
Evolution and Performance of Waterflooding in the Clearwater
PART 1
OVERVIEW
Since the 1960’s, the Clearwater Formation in the Cold Lake Area of Alberta has been associated with production of 100,000+ cP bitumen using Cyclic Steam Stimulation and SAGD. The four thermal projects operating in this formation have produced at approximately 250,000 B/d for the past decade and will soon reach 3 billion barrels of total production.
However, there is a new, promising production area in the Clearwater Formation in central Alberta. Unlike its counterpart at Cold Lake, the formation in this area is generally thinner, with lower average permeabilities. The oil is also lighter, but still classified as a heavy oil, with viscosities up to 1,000 - 10,000 cP and API gravities of 10 – 22 oAPI.
As a result, the area has been developed starting in 2017 using open-hole multi-laterals for primary production. Since that time, production has grown to over 140,000 B/d, with many developments planned. One estimate sets the OOIP in the main fairway at over 5 billion barrels and industry generally estimates a 5% recovery factor for primary depletion. With the successful primary development of this area has come a corresponding interest in the potential for waterflooding.
This work described herein was conducted from 2023 to 2024 - with data used through August 2024 - to address questions being asked as waterflooding began to be implemented, such as:
Is the Clearwater a reasonable resource to develop with waterflooding?
Are the current projects showing any positive responses?
If so, can we make an estimate of their impact on production and potential?
This paper presents the result of a study that was conducted through August 2024 to analyze the 40 existing waterflood projects to address these questions.
The paper is intended for a general audience that may not be familiar with all of the areas and concepts behind the analysis – waterflooding mechanisms, properties of the Clearwater formation, multi-laterals and primary depletion trends. To provide a common level of understanding for readers, the paper has been divided into two parts:
Part 1 is a primer to provide background and context for the subsequent analyses, results and conclusions for those who may be unfamiliar with the areas and concepts noted above.
Part 2 provides details of the analysis itself and the results and conclusions.
A brief Appendix is included at the end of Part 1 that discusses the stages of primary depletion and water injection in terms of their impacts on trends in the gas-oil ratio and oil rate.
These trends form the basis for the waterflood analyses presented in Part 2.
PART 1: Background on the Clearwater, multi-lateral development and waterflood analysis methodology
Introduction
The Clearwater Formation is part of the lower Mannville Group that spans from central to eastern Alberta, with outcrops along the lower course of the Athabasca River and the Christina River southeast of Fort McMurray. [1] Historical production from this formation has been from thermal processes in the Cold Lake area in eastern Alberta, in which the oil viscosity can exceed 100,000 cp in the 1-6 Darcy sands that comprise the Clearwater. Thermal production began in the 1960s at Imperial Oil’s pilots of Cyclic Steam Stimulation (CSS)at Cold Lake, expanding to CNRL’s CSS project at Primrose/Wolf Lake in the late 1990’s, and subsequent SAGD projects at Orion (Blackrod-Shell-OSUM-Strathcona) and Tucker (Husky-Cenovus-Strathcona) in the 2000’s. In 2024, production from these thermal projects averaged 271,000 B/d, or 17% of the total thermal production from Alberta. [2]
For almost 60 years, the Cold Lake region has been the focus of industry’s activity in the Clearwater. However, in the past decade a new region in central Alberta has been growing, in which open-hole multi-laterals have been used to economically develop the Clearwater under primary production.
The resource has two fairways – a main fairway just north of the town of Slave Lake (Figure 1) and a second one to the southeast, just south of the town of Athabasca (Figure 2). There are currently over 14,000 laterals in the two fairways.
In the analysis presented in this document, “Marten Hills” will refer to both West Marten Hills and Marten Hills areas.
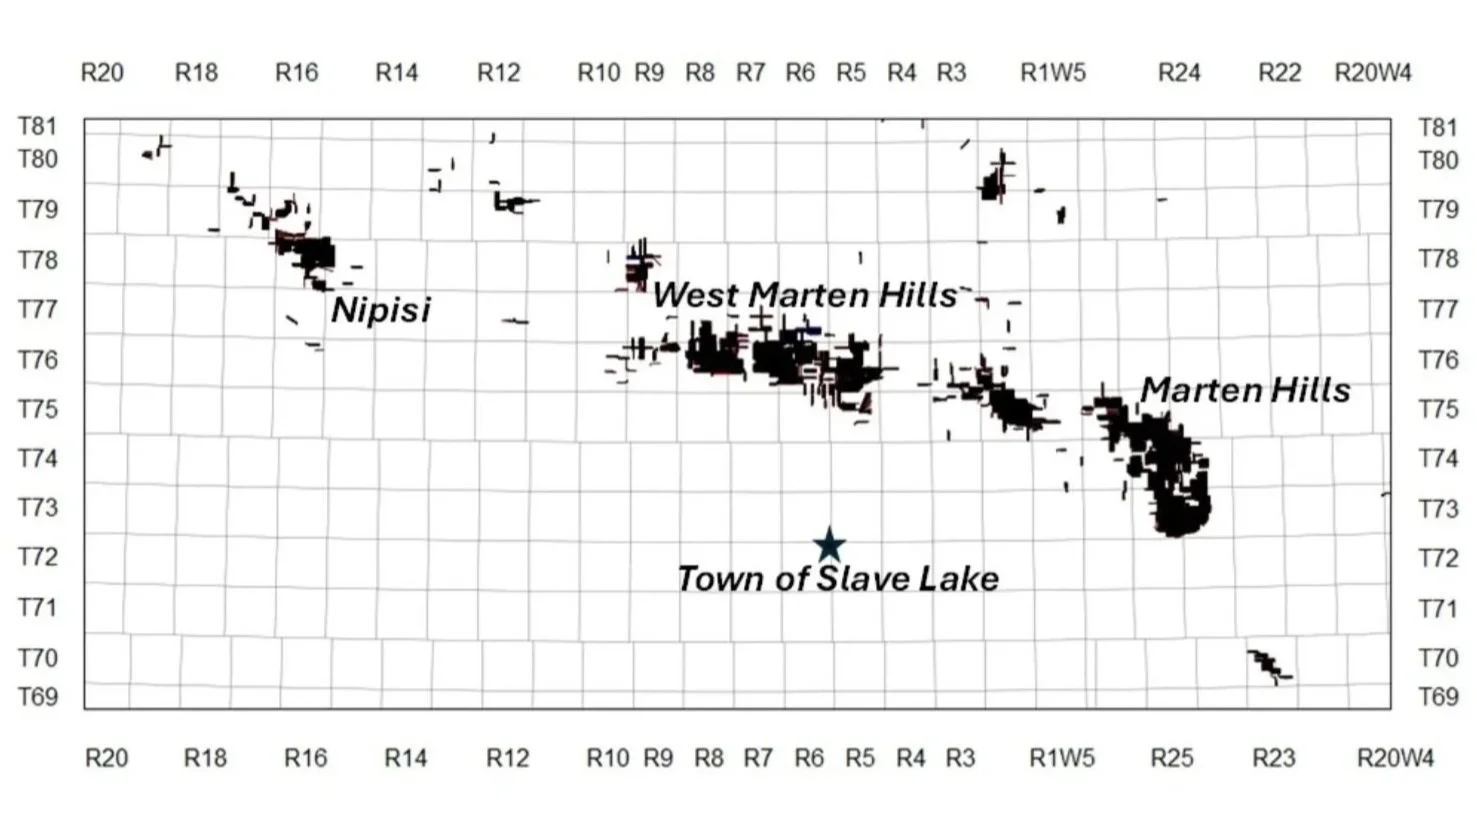
Figure 1: Main fairway of the Clearwater in central Alberta
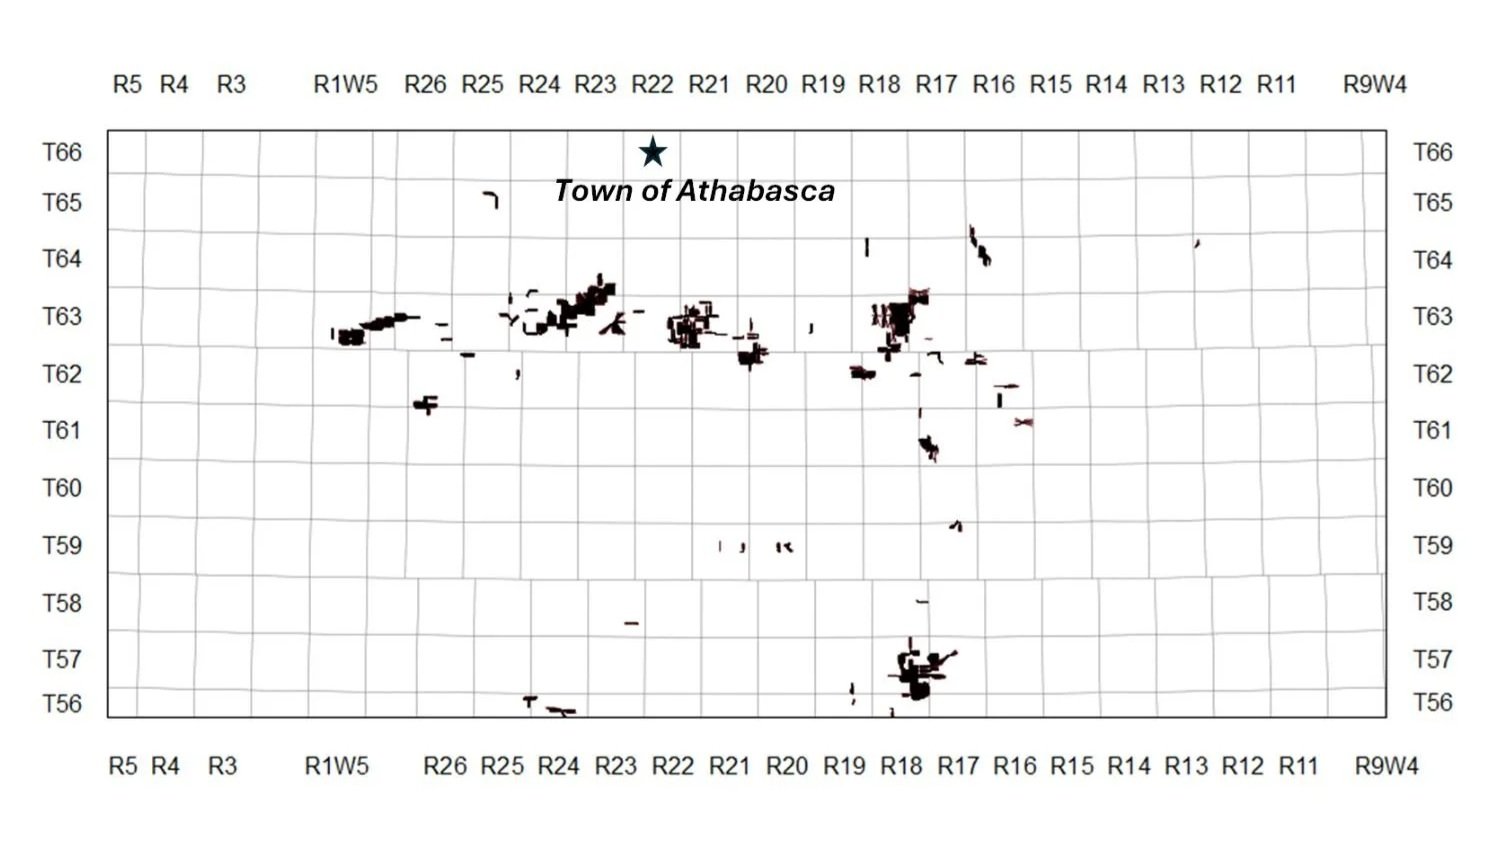
Figure 2: Southern fairway of the Clearwater in central Alberta
“Despite a setback in development and production during COVID, development of the resource has increased exponentially into 2023, rising from little production prior to 2018 to over 140,000 B/d by August 2024 (over 150,000 B/d in March 2025).”
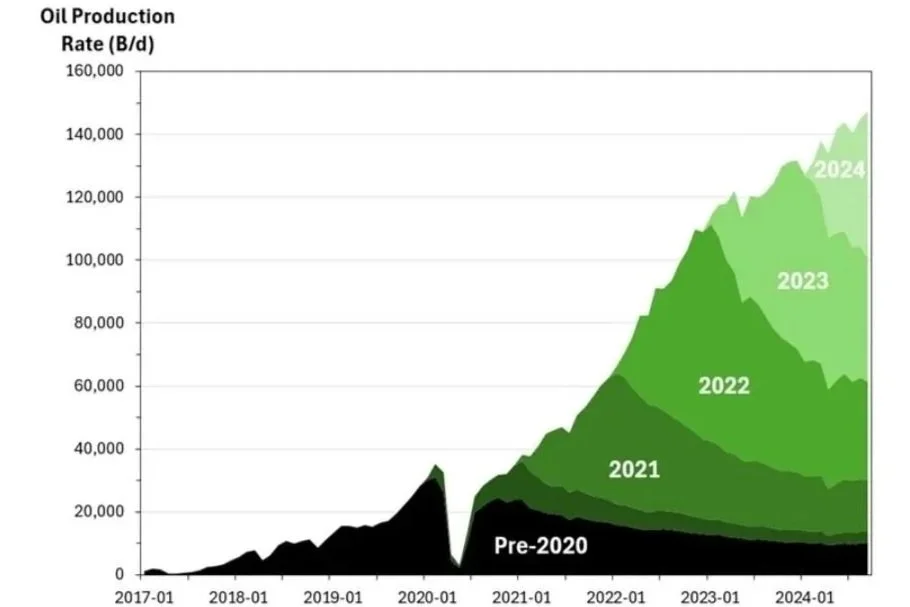
Figure 3: Production history for the Clearwater in central Alberta through August 2024
The production history for the Clearwater through August 2024 is shown in Figure 3 as a series of production wedges from wells that began production in the designated years.
The high annual decline rates shown by the wedges have led operators to generally assume that primary operations will only achieve a low recovery factor of 5% OOIP.
These factors – high declines and low recoveries – have provided incentives for operators to examine the potential for waterflooding in the Clearwater to partially mitigate declines, sustain rates and achieve higher recovery levels.
Clearwater Waterflooding Opportunity
The rock and fluid properties of the Clearwater in central Alberta are quite different from its counterparts in the more well-known Cold Lake area, and even from the relatively nearby Pelican/Brintnell waterflood/polymer flood that is being conducted by CNRL.
The oil that originally charged the Clearwater migrated from its source rock in western Alberta, going through the current Nipisi/Marten Hills and the Wabiskaw at Britnell eastward to Cold Lake.
“Decline rates for the total annual Clearwater production (all production under each wedge) are high compared to thermal processes, consistently over 40%/year and over 30%/year for the first two years of decline, respectively.”
Subsequent microbial degradation reduced the fraction of lower molecular weight hydrocarbons increasing the oil viscosities to various degrees, as summarized in the following table. A plot of the data ranges for these two parameters from Table 1 shows the trends more clearly:
Table 1: Rock and Fluid Properties of Clearwater and Wabiskaw [Sources: AER D54 reviews, geoSCOUT]
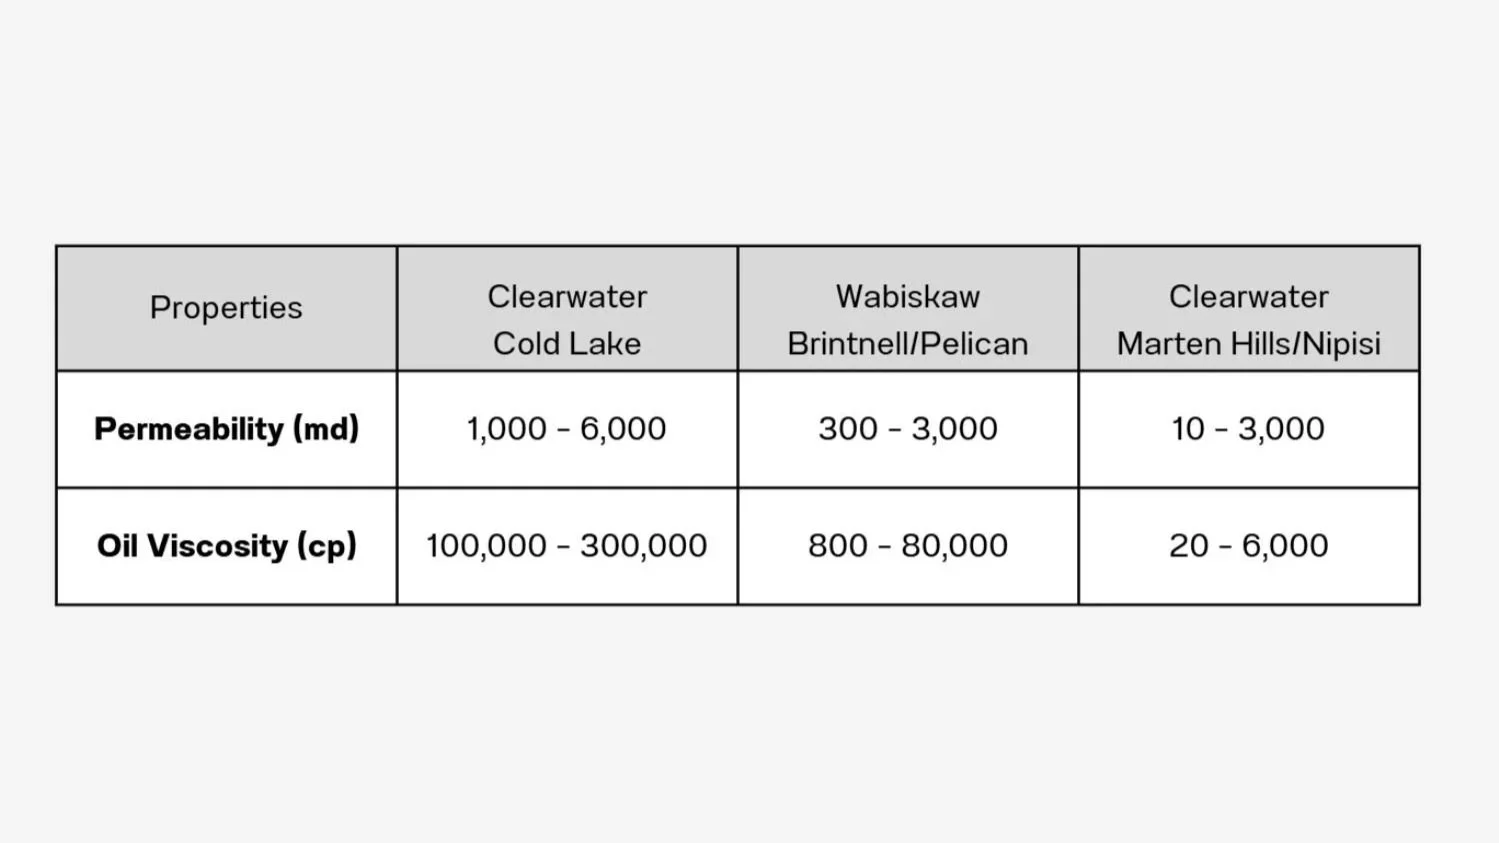
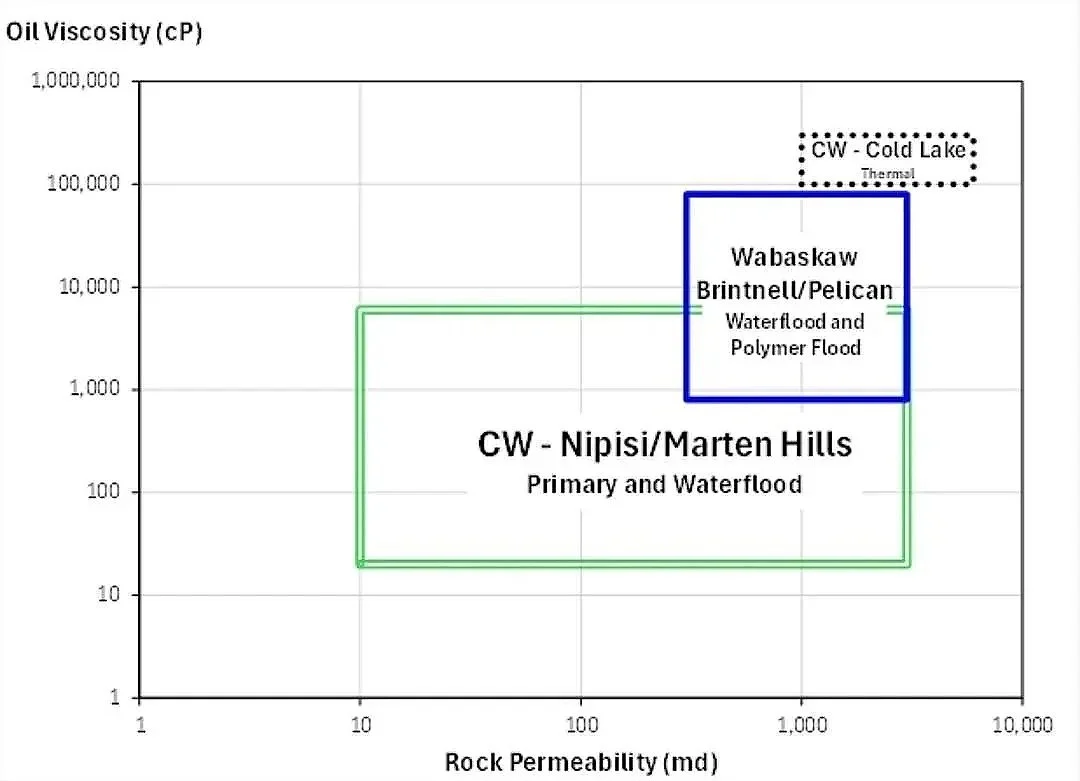
Figure 4: Cross-plot of ranges in oil viscosity against rock permeability for the Clearwater and Wabiskaw Formations in central Alberta
The trends shown in Table 1 and Figure 4 are consistent with other observations [3] that the degree of bio-degradation of oil in the Clearwater has trended with permeability, i.e. more permeable zones with higher hydrodynamic flow were more prone to biodegradation and thus higher oil viscosities.
“The rock and fluid properties for the Clearwater in central Alberta indicate that it should be a reasonable candidate for waterflooding.”
Waterflooding - Mechanisms
Waterflooding is genera ly viewed as a process in which water is injected into a formation to contact the resident oil, driving it to an adjacent producer, i.e. it is viewed as a displacement process that can span several years or decades of economic recovery.
But there is also the more subtle aspect of water injection for the purpose of maintaining reservoir pressure as the first stage of a waterflood. During primary depletion, the reservoir pressure is the driving force for oil production. As reservoir fluids are produced, the pressure in the reservoir wi l drop to below the oil’s bubble point and dissolved (“solution”) gas wi l come out of the oil and form a free-gas phase, to be produced with the oil. As the pressure in the reservoir drops further, oil production wi l correspondingly decrease and the produced gas-oil ratio (GOR) wi l increase.
An example decline of a type-curve for a Marten Hills well on primary decline is shown in Figure 5.
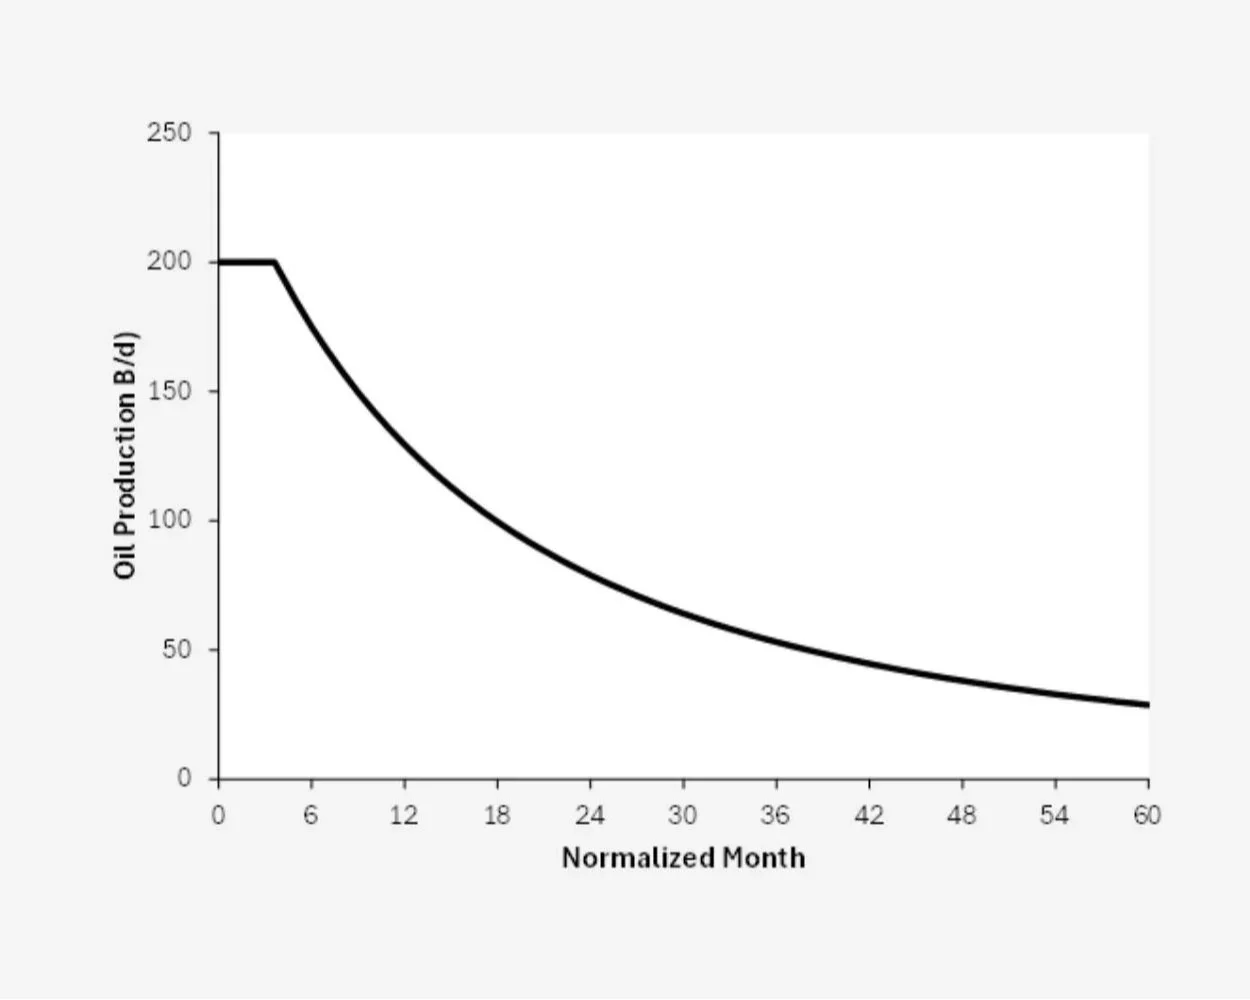
Figure 5: Example type curve for Marten Hills Well [4]
With water injection, the injected water can replace some or al of the volume of produced fluid and thus maintain the reservoir pressure and wel productivity. The sustained productivity can achieve higher recoveries than primary depletion.
For Marten Hills and Nipisi, operators have generally assumed the recovery factor will be increased from 5% for primary to 10% OOIP by water injection.
A key distinction between the displacement/sweep mechanism in “waterflooding” versus the pressure-support aspect of “water injection” is the potential timing of response. Waterflooding in light oil reservoirs has generally been implemented after longer periods of operation on primary. As a result, it may require a significant time for a bank of additional swept oil to be observed. This lag in response burdens the economics of investments for water injection and handling and treatment of the increased produced water volumes.
In contrast, water injection – especially if conducted early – can have an immediate or early impact on the production rate, since pressure travels much faster than fluid through a reservoir.
“At this time, waterfloods in the Clearwater should be viewed as water injection projects to sustain reservoir pressure and production rates.”
Production Responses
As noted in the previous section, there are two key metrics in primary depletion that result from declining reservoir pressure:
A declining oil production rate
Increasing production of gas that has come out of solution as a free phase.
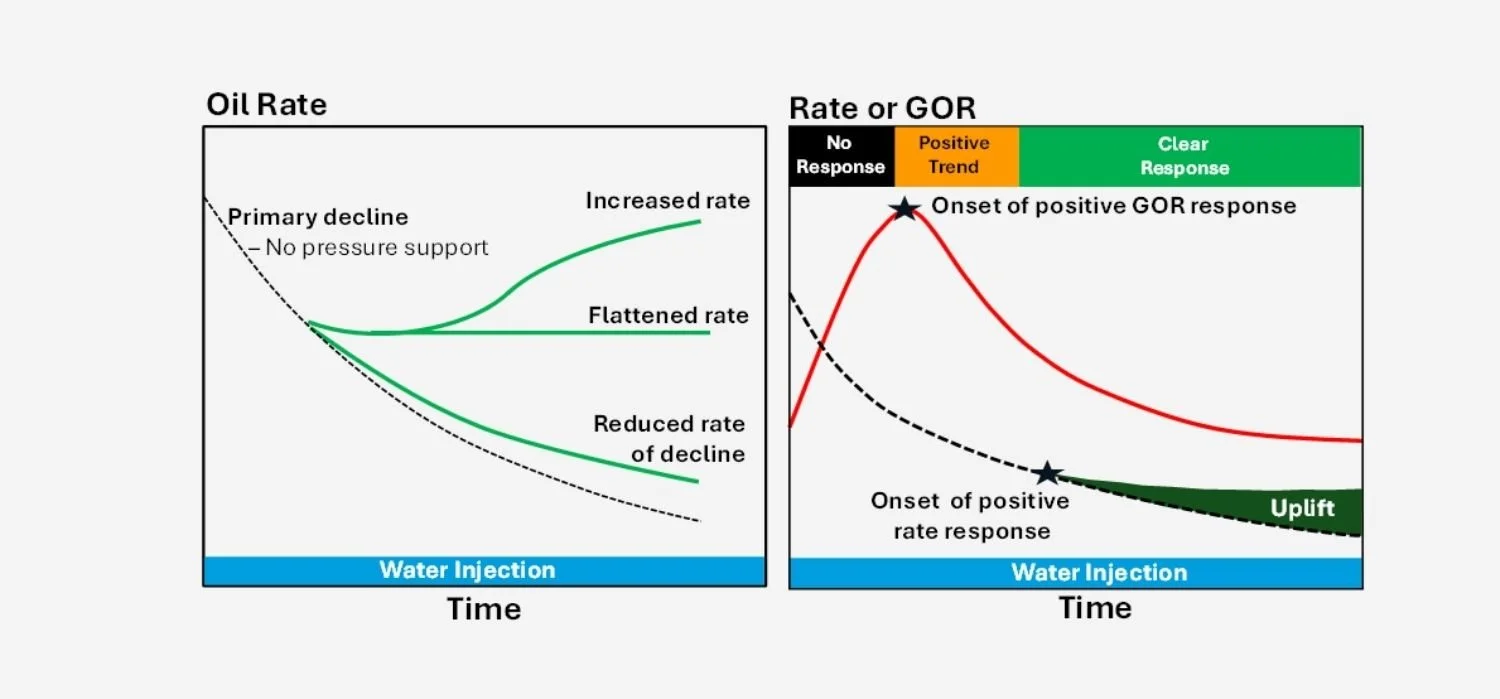
Figure 6: Expected impact of pressure support on (a) oil rate and (b) produced Gas-Oil Ratio
Both areas of the main fairway have low initial Solution Gas-Oil Ratios - below 100 scf/Bbl. However, because the free gas phase is much more mobile than the oil phase, the producing gas oil ratio can rise to be substantially higher than the original solution gas ratio.
Positive impact from water injection to increase/sustain pressure would thus result in:
Reductions in oil decline rates or oil rates that are flattened or increasing
Decreases in the producing gas-oil ratio.
These points are summarized graphically in Figures 6a and 6b and are described in further detail in the Appendix.
Key points here are that:
The onset of a marked decrease in GOR is a positive trend that can signify an impending impact on the oil rate.
In the absence of operational changes, a change in the oil rate above the expected primary decline curve is taken to denote a clear response to water injection.
The uplift in oil rate associated with the water injection can be taken to be the incremental oil rate above the expected primary rate.
Open-Hole Multi-laterals
Although there is a wide range of numbers of laterals per well – up to 12 - the most common ratio for a producing well is 6:1. An example of this well design is shown in Figure 7. Lateral spacing can be anywhere from 25 to 100 meters, with the average length of the laterals being 1,600m. So, on average, a well is able to access almost 10 km (6 x 1600m) of reservoir.
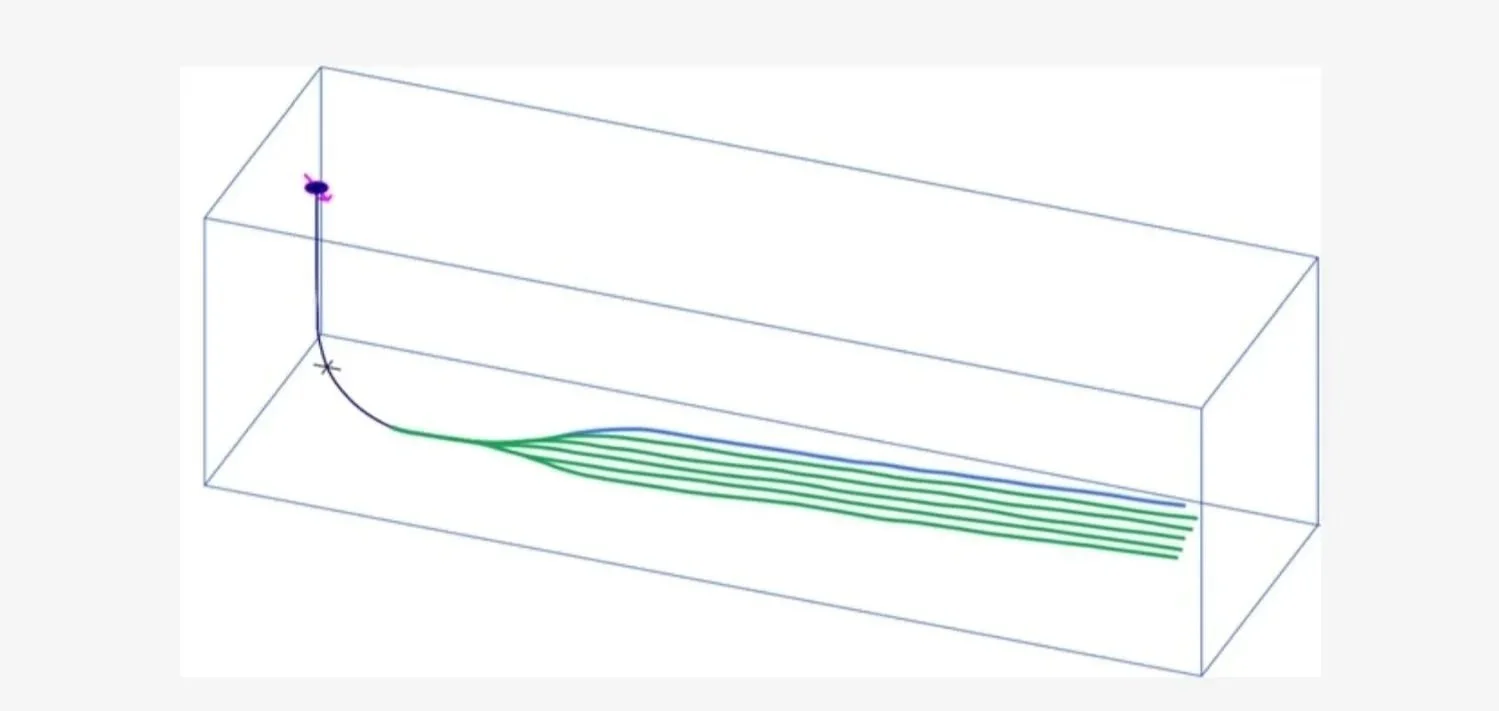
Figure 7: Example design of a multi-lateral used in the Clearwater [Source: geoSCOUT]
There are both advantages and disadvantages to using open-hole multi-laterals.
Advantages – economics of primary operations
Low drilling and completion costs - a well such as shown in Figure 7 would usually cost between C$1.5MM and C$2MM.
Quick and multiple payouts – a well with the production history shown in Figure 5 would pay out its investment within a year, with several ensuing payout periods during its life. [4]
Disadvantages – optimization, analysis and remediation
Because the laterals drilled from the main well are open-hole, the operator has no control over - or knowledge of - flow into/from individual laterals. There is thus very limited ability to optimize or diagnose / remediate problems.
Well designs for primary depletion may not be optimal – or possible – for waterflooding. If waterflooding is to be implemented, its requirements must be considered in the initial well design for primary development.
Well Configuration Design
A key influence on the design of wells for primary and secondary waterflood depletion is the pay thickness. In the Marten Hills area, the pay thickness ranges from 8 – 27 m, averaging 18 m. In the Nipisi area, the pay ranges from 3 – 10 m, averaging 6 m.
Marten Hills: Because of the thick pay in Marten Hills, wells are drilled in tiers and the pay is waterflooded in a “bottoms-up” approach. Where the pay is sufficiently thick, up to three tiers of producing wells can be placed, with an injection tier near the base of the pay. Later in a project’s life, the injected water will break through to the closest tier of producers. After breakthrough has occurred and water cuts become so high as to be uneconomic in this tier, the expectation is that the tier will be converted to being the water injection tier.
Nipisi: The thinner pay at Nipisi means that its development is done with a single tier of injecting and producing laterals. In a normal waterflood, this would often be accomplished via a “line drive” configuration for horizontal wells, with alternating producers and injectors. This is generally true for Nipisi from a high-level perspective, although the number of laterals associated with each well can usually range from one to three laterals.
Configurations for both areas are shown below, with generalized elevation perspectives in Figure 8, along with plan views for specific projects shown in Figure 9.
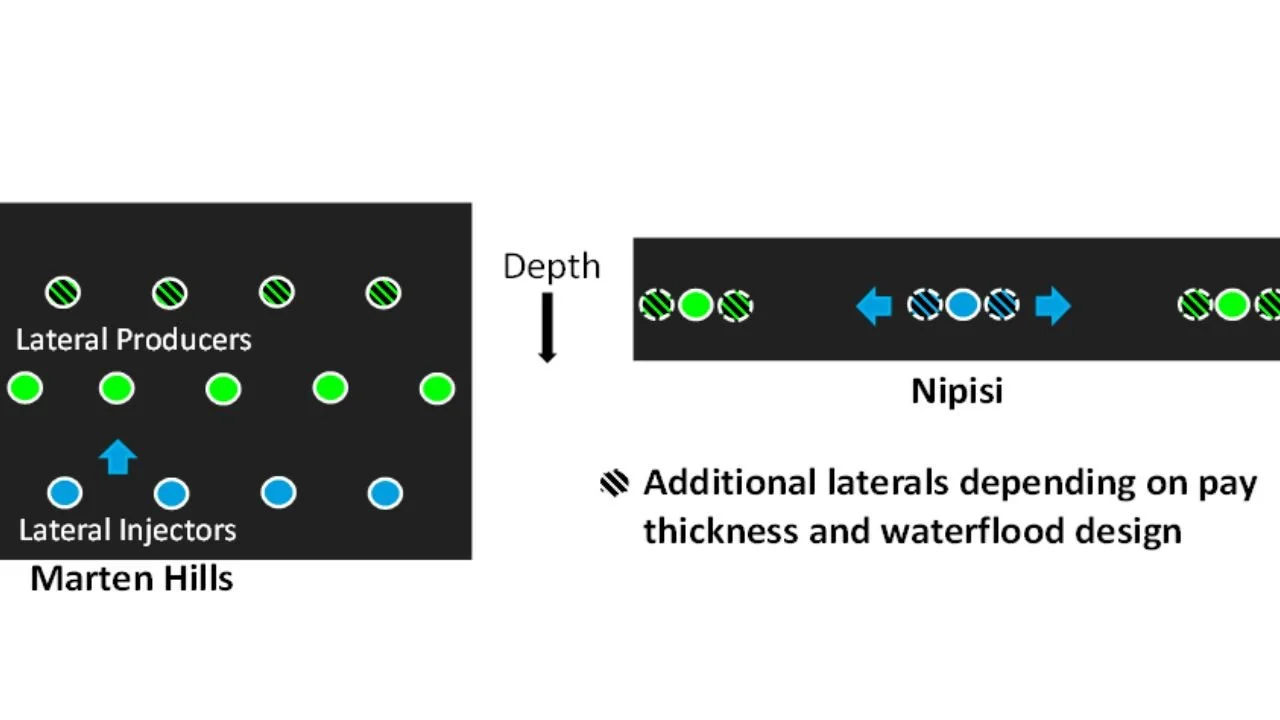
Figure 8: Example designs of multi-laterals used in the Clearwater [Source: geoSCOUT]
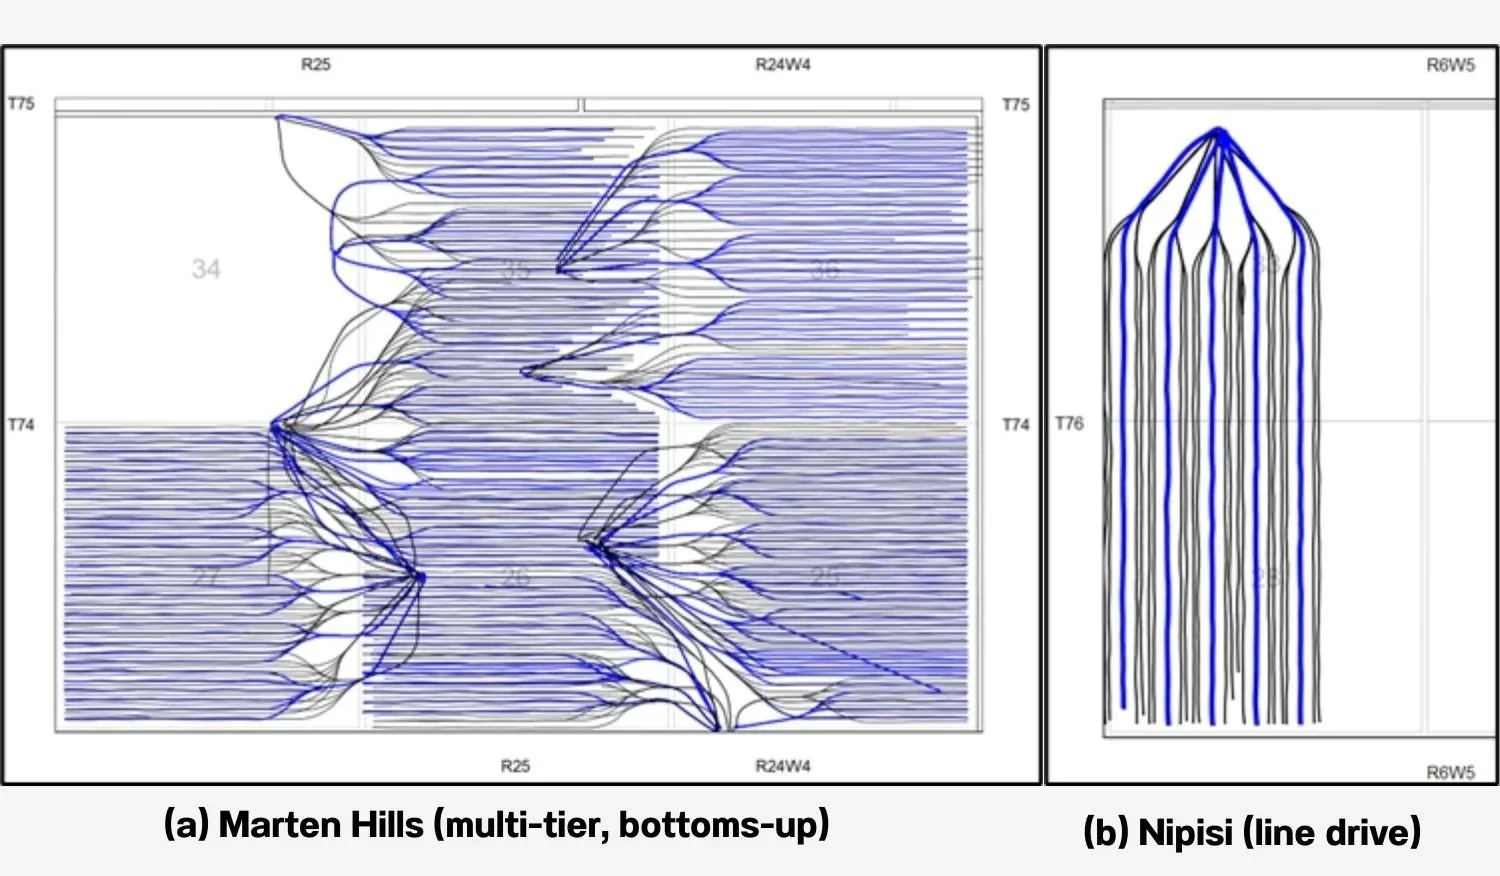
Figure 9: Example waterflood projects in the Clearwater [Source: geoSCOUT
As of August 2024, there were 40 waterflood projects in the Clearwater main fairway. The waterfloods were conducted by three of the major operators in the Clearwater – Headwater Exploration, Spur Petroleum and Tamarack Valley Energy. A “project” was defined as a contiguous group of injectors and associated producers for which water injection was initiated at about the same time. As shown in Figure 10, these projects spanned the full range of existing development in the main fairway of the Clearwater.
A high-level description of the waterflood projects is shown in Table 2.
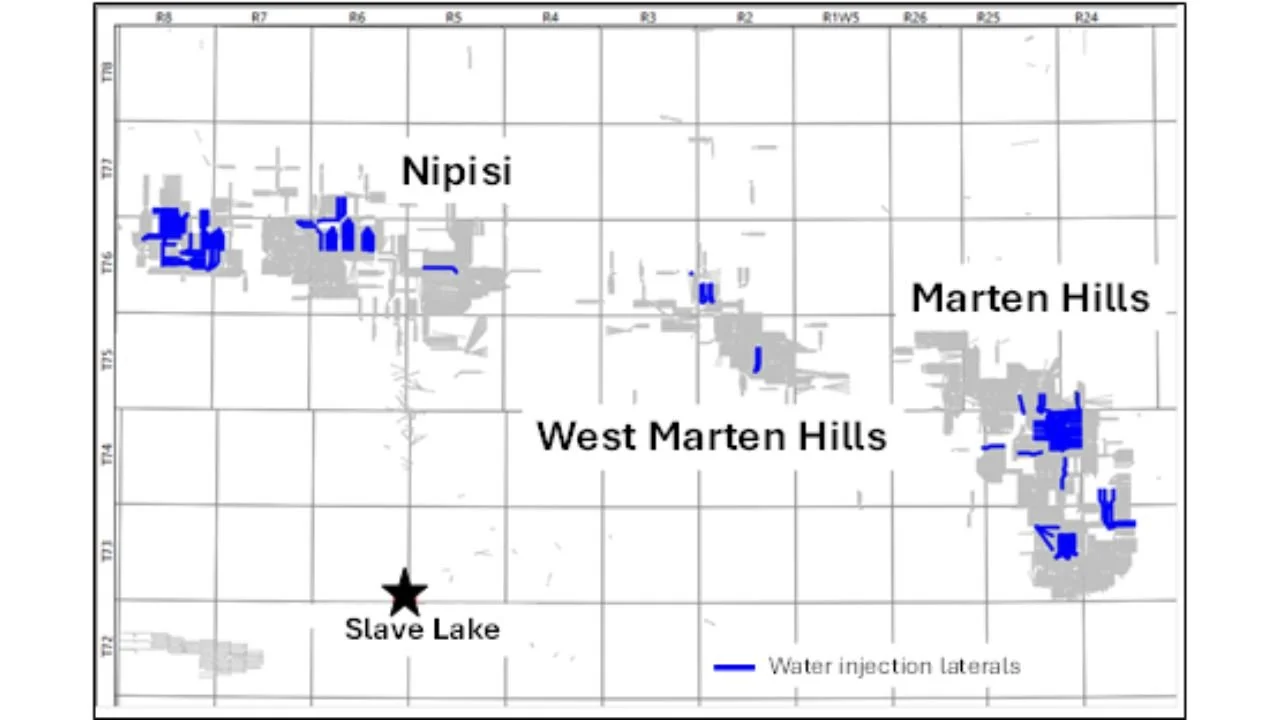
Figure 10: Clearwater waterflood projects in August 2024 [Source: geoSCOUT]
Table 2: Scope of Clearwater waterflood projects in August 2024 [Source: geoSCOUT]
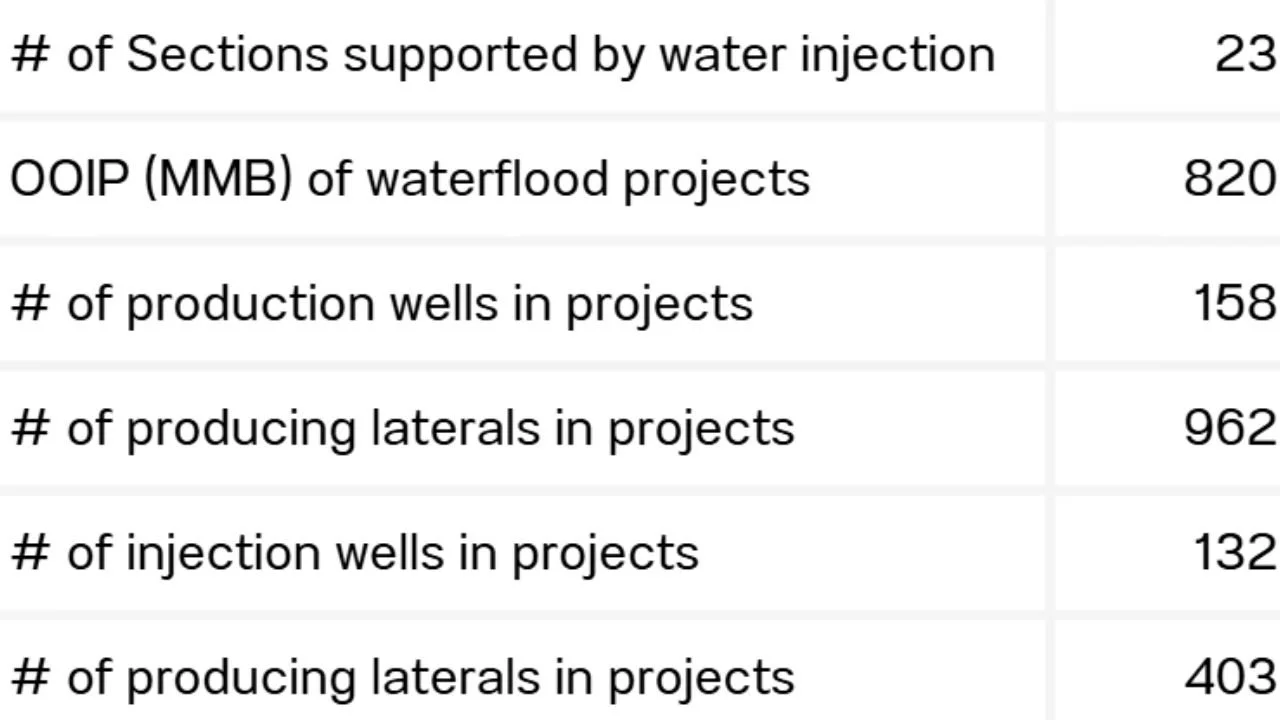
For reference, the entire primary development to date on the map spans about 310 sections (150 in Nipisi, 40 in West Marten Hills and 120 in Marten Hills).
“Water injection has been implemented in only about 7% (23/310) of the developed main fairway of the Clearwater in central Alberta.”
Analysis Methodology
After the specific wells associated with each project were identified, oil decline curves were developed for each project.
If there was sufficient production from project wells prior to water injection and the wells were clearly on decline, the declining oil rate was matched by the standard Arps equation.
If there was only a short period of pre-water injection such that the wells had not yet demonstrated steady declines (potentially because some pressure support had already been achieved), decline curves were developed by matching the Arps equation to offset wells on primary decline in nearby resource.
If there were several producing wells in the project, the total primary decline rate of the project was computed as a sum of the individual decline curves.
The monthly volume uplift for the project was then computed from the difference between the actual field rates and the decline model rates.
The trends in producing GORs were tracked to ensure that the assigned timing of the initial decline was consistent with declining GORs.
The study was conducted using data through August 2024.
In Part 2 of this presentation, the concepts and methodologies described in Part 1 are used to analyze production characteristics in 40 waterflood projects that were underway through August 2024. The results of these analyses provide definitive support and commentary on the degree of success of waterflooding to-date, as well as a quantitative assessment of their contribution to total production from the main fairway of the Clearwater.

Dr. Bruce Carey, is the Sr Technical Advisor, Research at Peters & Co. Limited, an investment institution specializing in the Canadian energy sector. In this role, he provides technical analyses and assessments of resources, projects and technologies to support investment decisions across the upstream and downstream, with particular focus on the in situ thermal sector.
He is a Chemical Engineer by training, with degrees from Stanford University and the University of Minnesota. Prior to his current role, he spent his career working for Exxon and Imperial for 32 years in a variety of upstream technical and management assignments.
APPENDIX
Stages of Primary Depletion and Water Injection, Trends and Terminology
During primary depletion and waterflooding of reservoirs that do not initially have gas caps – such as the Clearwater reservoirs at Nipisi and Marten Hills - the fluid phases in the reservoir and those being produced will go through 6 stages:
Stage 1 (Primary – no free-gas phase) – The reservoir pressure energy that is stored in the compressed oil and water is the driving force for oil production. The volume of gas that is dissolved per unit volume of oil is termed the “Solution GOR”. When production begins, pressure in the reservoir begins to decrease. The ratio of produced gas to produced oil is termed the “Produced GOR”. At this stage, this will equal the Solution GOR, since the gas is fully dissolved in the oil.
Stage 2 (Primary – immobile gas phase) – The reservoir pressure declines below the bubble point and gas comes out of solution into a separate phase. However, as long as the evolved gas phase saturation remains below a critical value (e.g. 5% of the pore space), the evolved gas bubbles will expand but not flow. This provides a “solution gas drive” to continue to provide partial support to drive the oil production. The Produced GOR will remain the same as the original Solution GOR.
Stage 3 (Primary – free gas flow) – The reservoir pressure continues to decline further and the free-gas saturations are high enough for gas to flow as a free phase. Although the actual saturations of the gas in the reservoir can remain low, the low viscosity of the gas makes it more mobile than oil in the reservoir. The free gas phase will thus be produced at an ever-increasing Produced GOR.
Stage 4 (Water Injection – impact on GOR) – The ratio of the water injection rate to the total fluid production rate is termed the “Voidage Replacement Ratio (VRR)”, which can be expressed either on a daily, monthly, yearly or cumulative-to-date basis. If this ratio on a daily basis is >1, then fluid injection will exceed fluid production and the reservoir pressure will begin to increase and gas will partially dissolve back into the oil. With continued injection and further dissolution, the Produced GOR will reach a maximum and then begin to decline.
Stage 5 (Water Injection – pre-water breakthrough) – As injection continues, the Produced GOR will continue to decrease. When sufficient voidage has been replaced – generally observed to be less than a relatively low cumulative VRR (e.g. 0.3) - the produced oil rates can exhibit three trends:
reduced rate of decline
flattened rate (no decline)
increasing rate (potentially exceeding the initial production rate)
These impacts and trends are shown in Figure 6a in the main text. At this point, water injection has repressurized the reservoir, but the injected water has not been produced.
Stage 6 (Water Injection – post-water breakthrough) – at some point, the injected water will break through to a producing well and will displace a fraction of the oil production rate. The fraction of the water in the produced fluid stream – termed “water cut” - will depend upon several factors such as water/oil viscosity ratio, relative permeabilities of the fluids, degree of channeling of the injected water through the more viscous oil, and potential coning of water up into the producers in vertical waterfloods.