
Evolution and Performance of Waterflooding in the Clearwater
PART 2
OVERVIEW
Since the 1960’s, the Clearwater Formation in the Cold Lake Area of Alberta has been associated with production of 100,000+ cP bitumen using Cyclic Steam Stimulation and SAGD. The four thermal projects operating in this formation have produced at approximately 250,000 B/d for the past decade and will soon reach 3 billion barrels of total production.
However, there is a new, promising production area in the Clearwater Formation in central Alberta. Unlike its counterpart at Cold Lake, the formation in this area is generally thinner, with lower average permeabilities. The oil is also lighter, but still classified as a heavy oil, with viscosities up to 1,000 - 10,000 cP and API gravities of 10 – 22 oAPI.
As a result, the area has been developed starting in 2017 using open-hole multi-laterals for primary production. Since that time, production has grown to over 140,000 B/d, with many developments planned. One estimate sets the OOIP in the main fairway at over 5 billion barrels and industry generally estimates a 5% recovery factor for primary depletion. With the successful primary development of this area has come a corresponding interest in the potential for waterflooding.
This work described herein was conducted from 2023 to 2024 - with data used through August 2024 - to address questions being asked as waterflooding began to be implemented, such as:
Is the Clearwater a reasonable resource to develop with waterflooding?
Are the current projects showing any positive responses?
If so, can we make an estimate of their impact on production and potential?
This paper presents the result of a study that was conducted through August 2024 to analyze the 40 existing waterflood projects to address these questions.
The paper is intended for a general audience that may not be familiar with all of the areas and concepts behind the analysis – waterflooding mechanisms, properties of the Clearwater formation, multi-laterals and primary depletion trends. To provide a common level of understanding for readers, the paper has been divided into two parts:
Part 1 is a primer to provide background and context for the subsequent analyses, results and conclusions for those who may be unfamiliar with the areas and concepts noted above.
Part 2 provides details of the analysis itself and the results and conclusions.
A brief Appendix is included at the end of Part 1 that discusses the stages of primary depletion and water injection in terms of their impacts on trends in the gas-oil ratio and oil rate.
These trends form the basis for the waterflood analyses presented in Part 2.
In Part 1 of this paper, the concepts and methodologies used in the performance analyses for 40 waterflood projects were reviewed.
You can read Part 1 of this paper HERE.
Part 2 now presents the results, showing examples across the range of individual projects and the main Clearwater fairway. These results provide definitive support and encouraging conclusions regarding the performance to-date and the future potential for waterflooding in the Clearwater.
PART 2: Results and Conclusions of Waterflood Analysis
Representative Analyses
Once the project data – fluid and gas rates, GORs and water cuts - were assembled, the primary curves for projects were developed and the uplifts computed. The following charts provide some example analyses from different types of well configurations and producing areas.
Example: Nipisi Horizontal Waterflood
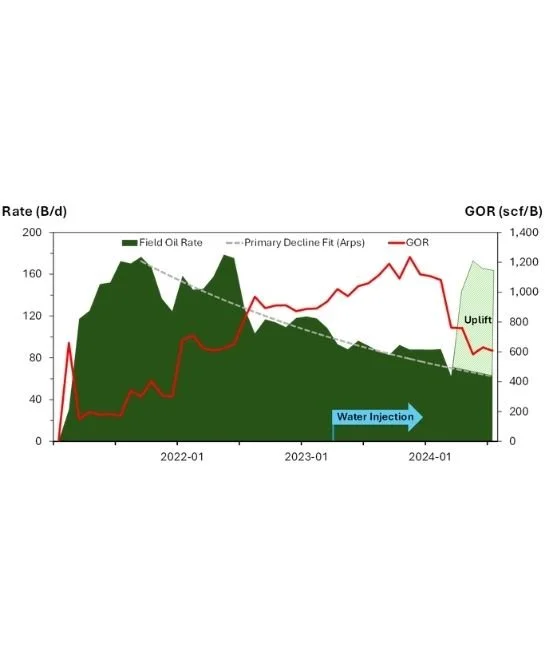
Figure 11: Example waterflood project – Nipisi horizontal waterflood [Source: geoSCOUT, Peters & Co. Limited]
In this example, the project was produced on primary for 2.5 years prior to any water injection. During primary depletion, the oil rate declined from about 180 B/d to about 80 B/d, while the producing GOR rose from its initially low solution GOR to over 1,000 scf/B, following the trends shown in Part 1 of this paper. As shown in Figure 11, the oil rate declined reasonably well along the Arps model curve for three years.
Water injection began in Q2 2023. For the next 6 months, the GOR continued to climb, to a peak of 1,200 scf/B. Approaching the end of 2023, the GOR began a steep decline. After about 8 months, the oil rate showed a sharp upward deviation from the primary curve - as shown by the cross-hatched area in the figure - while the GOR continued to decrease. By the end of the study period in August 2024, the oil rate had stabilized, with three months of production at its initial peak rate of 160 B/d, while the GOR stabilized at 600 scf/B. During August 2024, the project showed about a 70 B/d uplift over the expected primary performance.
This is an excellent example of the initial indication of pressurization by the falling GOR that precedes a subsequent clear increase in oil rate.
Example: Marten Hills Vertical, Multi-Tier Waterflood #1
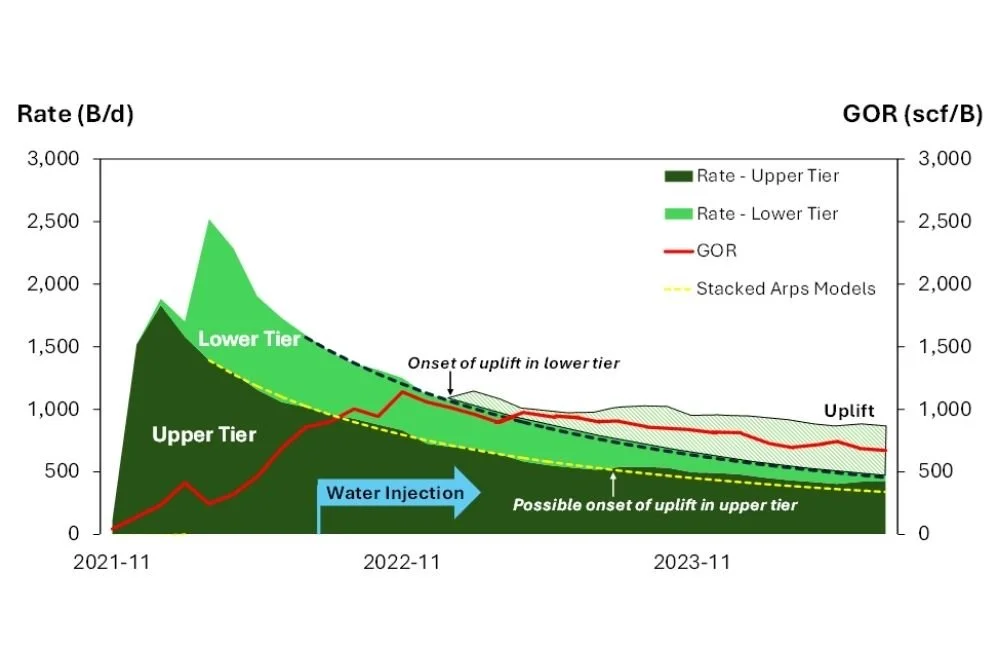
Figure 12: Example waterflood project – Marten Hills vertical multi-tier waterflood [Source: geoSCOUT, Peters & Co. Limited]
The resource for this project was sufficiently thick that the operator developed it with two tiers of producers with an underlying tier of injectors. The upper tier was first produced on primary for two months before the lower tier was put onto production. Water injection was initiated after about 18 months of primary production. Arps primary depletion curves were developed for each of the producing tiers. The producing GOR for the project reach a maximum of 1,000 scf/B at the end of 2021.
Total production from both tiers followed the decline curves well through early 2022, while the project GOR decreased from its peak. In Q1 2023, production from the lower tier showed the start of a positive deviation from its primary decline curve, while the upper tier continued along its primary track. Through the remainder of the study period, the GOR continued its decline while production from the lower tier grew. In Q4 2022, the upper tier began to show a positive deviation. By the end of the analysis period, the deviation had grown to comprise about 25% of the daily production from the upper tier.
In addition to confirming the expected trend as noted in the previous example, this project also shows consistency in its performance, in that the response to water injection was first exhibited in the lower tier, which was closer the injection in the bottom tier.
This example also shows the value of developing primary decline curve for each of the layers or producing wells to develop an assessment of the project, rather than analyzing it as grouped production. The pressure effect impacted the lower tier earlier, both in terms of rate uplift and (not shown) GOR reduction. The decline in the project’s GOR appears slower than shown in the prior example because it is a combination of a declining GOR in the lower tier, and a higher GOR from the upper tier that had not yet been impacted. In more extreme cases, the impact of the high GOR in the upper tier completely masked the decline in the lowest tier, resulting in a rising GOR for the project.
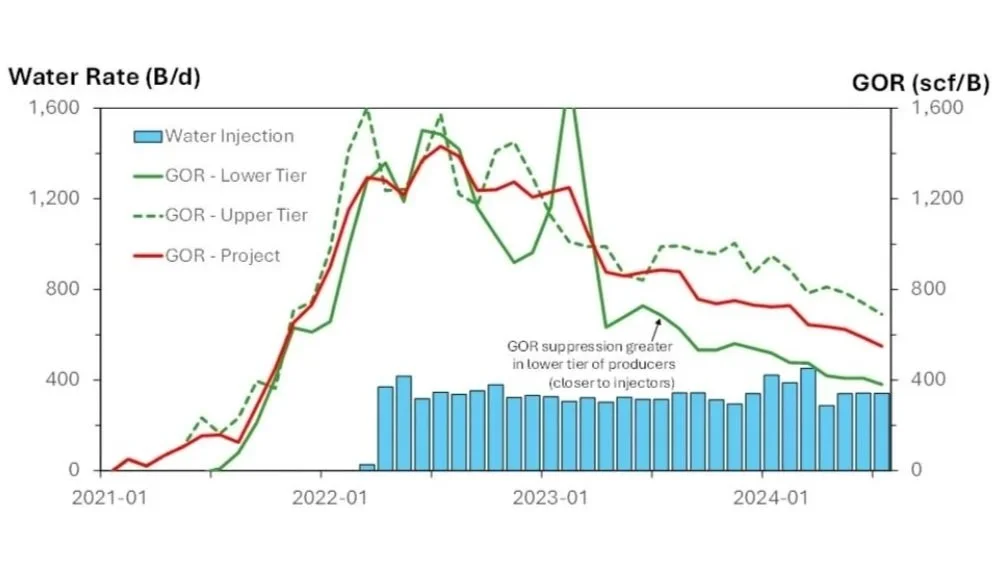
Figure 13: Example of sequential impact of pressure on producing tiers in waterflood project – Marten Hills vertical multi-tier waterflood
[Source: geoSCOUT, Peters & Co. Limited]
Example: Marten Hills Vertical, Multi-Tier Waterflood #2
During primary operation, the tiers exhibited a consistent rise to a plateau of about 1,400 scf/B through the early stage of water injection. The data show a 4 to 6-month lag between the decline of the lower tier (the spike in early 2023 notwithstanding) and the upper tier. With this lag, the producing wells maintained a consistent separation of about 300 scf/B through the end of the analysis period.
Results
Rate of Success
The analyses shown in these figures were conducted on all 40 projects (20 in Marten Hills and 20 in Nipisi).
The analyses showed that through August 2024:
30 projects showed both GOR suppressions and rate uplifts over primary.
4 projects showed GOR suppressions, but did not exhibit rate uplifts.
6 projects did not exhibit positive responses in either GOR or rate.
The absence of any response does not necessarily indicate a failure of the project. Rather, it may not have yet had sufficient water injection to materially replace voidage from prior production.
Distribution of Rate Uplifts
The distribution of rate uplifts in projects in the Marten Hills and Nipisi areas during August 2024 are shown in Figure 14. The total heights of the bars show the project rates in August 2024, the solid black bars show the predicted rates if the projects had remained on primary, and the green bars show the associated uplifts. For each area, the projects are arranged in order of decreasing uplift.
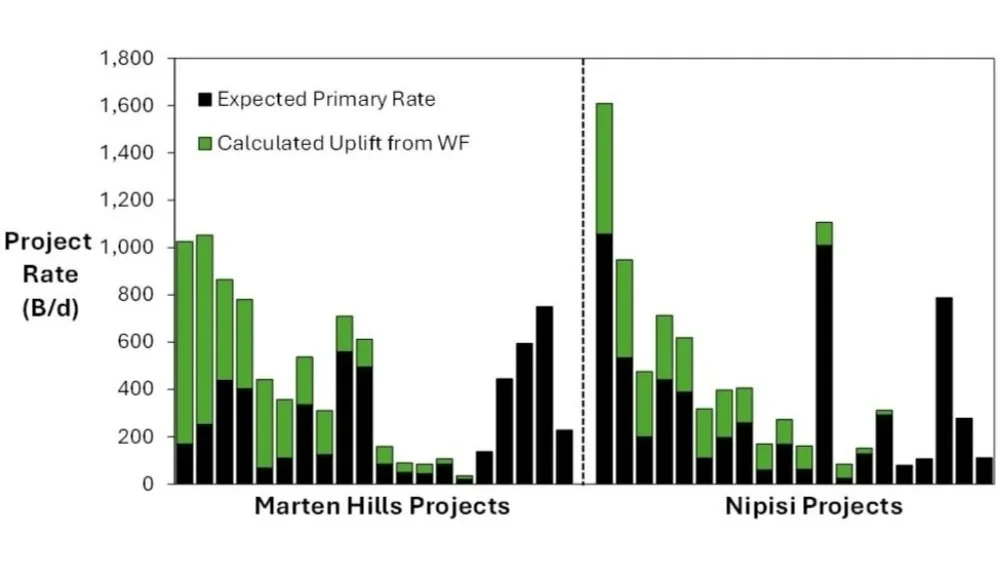
Figure 14: Distribution of rate uplifts in projects [Source: geoSCOUT, Peters & Co. Limited]
Some key points from this figure are:
There is a wide range of projects sizes and uplifts – some of the projects are small, and although the projects may have been assessed as technically successful, the volume of uplift added to the total production is small.
In seven of the projects, the uplifts provided over 50% of the projects’ current production.
Total uplifts are calculated to be ~4,000 B/d for Marten Hills and ~ 3,000 B/d for Nipisi.
The largest 5-6 projects in each area comprised about 75% of the total uplift.
“The high percentage of projects showing clear responses supports the conclusion of successful implementation of water injection in the Clearwater.”
Distribution of GOR Suppression
The distribution GOR suppression in the projects in August 2024 are shown in Figure 15.
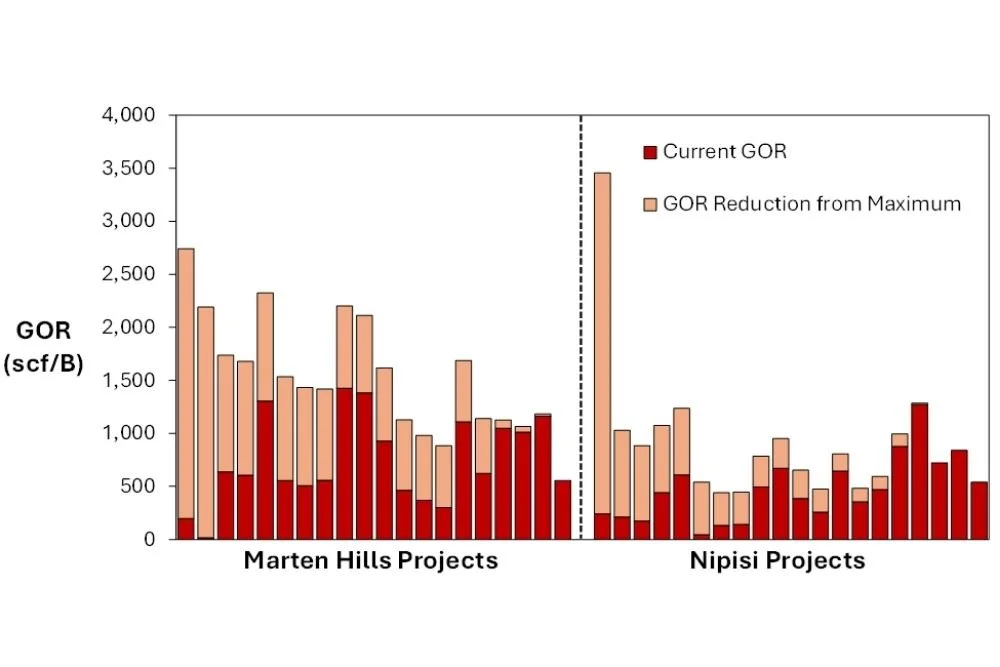
Figure 15: Distribution of GOR suppression in projects [Source: geoSCOUT, Peters & Co. Limited]
Here, the total heights of the bars show the highest GORs observed during the lives of the projects to-date. The red bars show the projects GORs in August 2024, and the tan bars show the associated suppressions of the GORs from their highest values. For each area, the projects have been arranged in order of decreasing GOR suppression. Discussions with the operators have suggested that the reduction of GORs to below 500 scf/B would be viewed as an indicator that pressure support has been successfully achieved. As seen in Figure 15, many of the projects are now in this range.
Note – since the projects are shown in order of decreasing GOR suppression for each geographic area, the relative positions of projects in Figure 15 and Figure 16 do not necessarily coincide.
Some key points from this figure are:
GOR suppression was observed in over 80% of the projects.
The level of GOR suppression can be substantial.
25 of the projects had GORs that were reduced to – or near – the 500 scf/B “success” threshold.
Some projects have shown no suppression but have low GORs – this is an indication that the project received water injection quite early on, even at the start of operations. In these ocases, the projects may have also been assigned uplifts if the rate was above the primary decline developed from an analog well.
Distribution of Water Cuts
The distribution of water cuts in the projects during August 2024 are shown in Figure16. This metric is tracked because a high water cut – or significant change in water cut – can indicate the channeling of water from an injector to a producer.
In the extreme, this could precipitate the need for mitigation steps or – in the case of vertical waterfloods in multi-tier projects – conversion of producers to injectors.
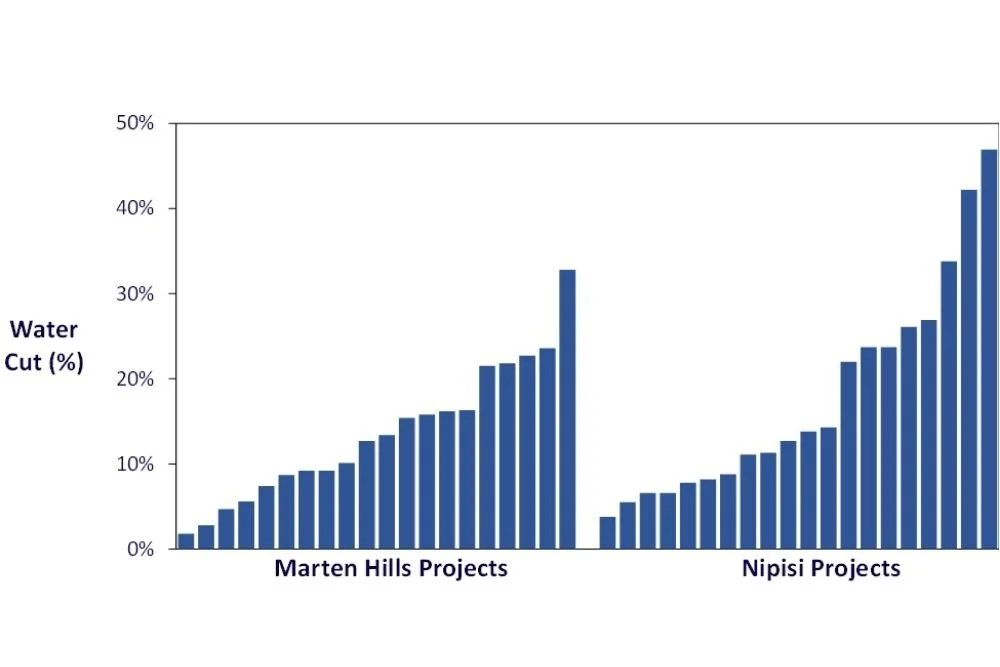
Figure 16: Distribution of water cuts in projects [Source: geoSCOUT, Peters & Co. Limited]
Two important points:
As indicated in Part 1, by the nature of the open-hole multi-laterals, increases in water production can only be traced to the specific producing well(s), but not any specific producing lateral. If water has channeled to one lateral while the associated laterals continue to produce normally, the overall change in water cut from the well could be subtle.
Operators have indicated that as long as (1) the projects have the capacity to handle increase water and (2) production from a well that is experiencing high water cuts is still economic, there is not an issue and operations will continue.
Most wells in the Clearwater main fairway begin producing with water cuts in the range of 10-20%, which is reasonable for the moderate 62% - 68% initial oil saturations in the fairway. As shown in Figure 17, most of the water cuts remain in this range, with a few notable exceptions in each geographic area.
Examples of Projects with Elevated Water Cuts
Marten Hills Well – 32% Water Cut
This project covers section 35 as shown in the map in Figure 10, consisting of 7 producers (60 laterals) and 7 injectors (32 laterals). Water injection in the bottom tier was initiated 16 months after the start of production. During the period prior to injection, a stable water cut of 5% was observed. But since that time, (1) water injection rates increased, (2) the oil rate consistently declined from its peak shortly after the start of injection, and (3) the project water cut correspondingly increased to 32%, as shown in Figure 17.
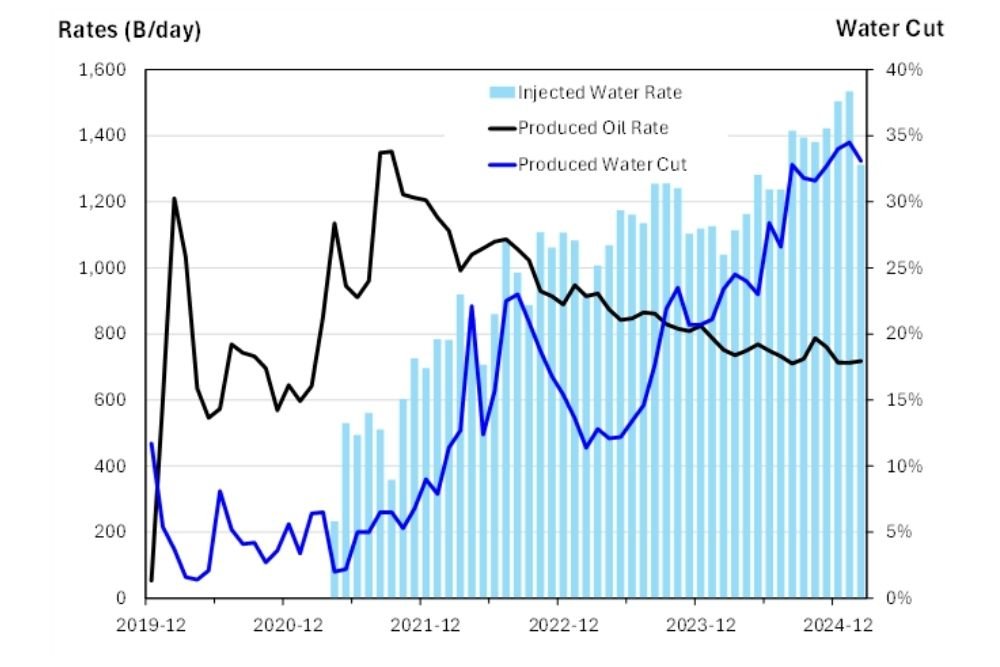
Figure 17: History for higher water-cut project – Marten Hills [Source: geoSCOUT]
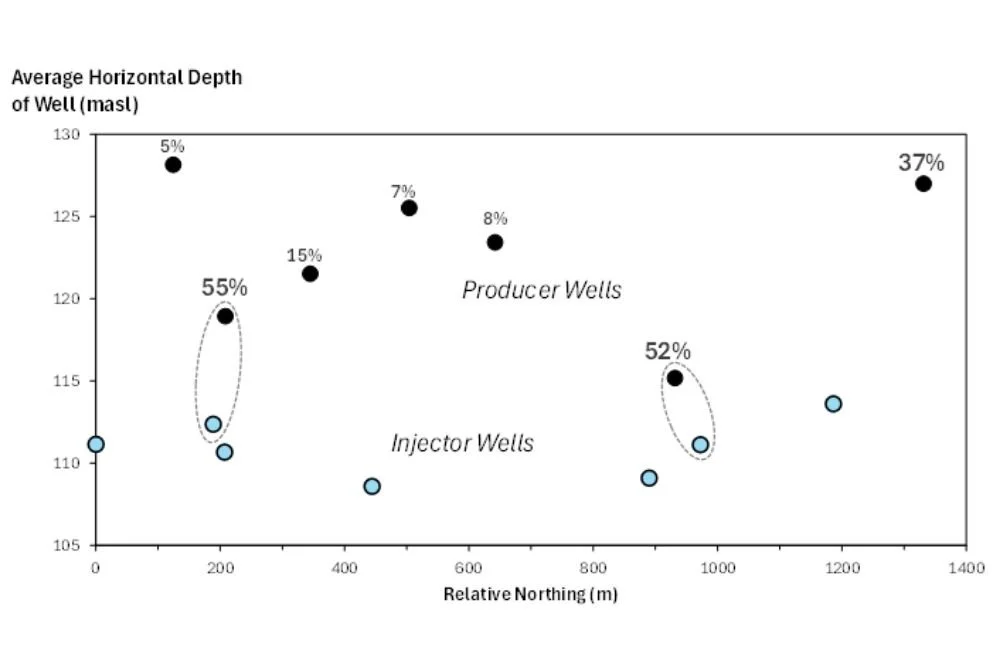
Figure 18: Elevation view of average well depth and associated water cuts for producers in higher water-cut project [Source: geoSCOUT, Peters & Co. Limited]
Note that for simplification, this figure only shows the average subsea depths and northings of the wells and does not include their associated laterals.
As pointed out earlier, the limitations imposed by the use of open-hole laterals (one of the producers has 12 laterals associated with it), there is little that can be done to control the water, other than possibly decreasing the water rate into the underlying injector.
The project clearly had communication between some of the injectors and some of the producers, but it is also producing at a reasonable oil rate of 700 B/d. This rate also appears to have stabilized as a result of the pressure support.
Nipisi Well – 47% water cut
As shown in Figure 19, this project has 2 producers (18 laterals) and 5 single-leg injectors.
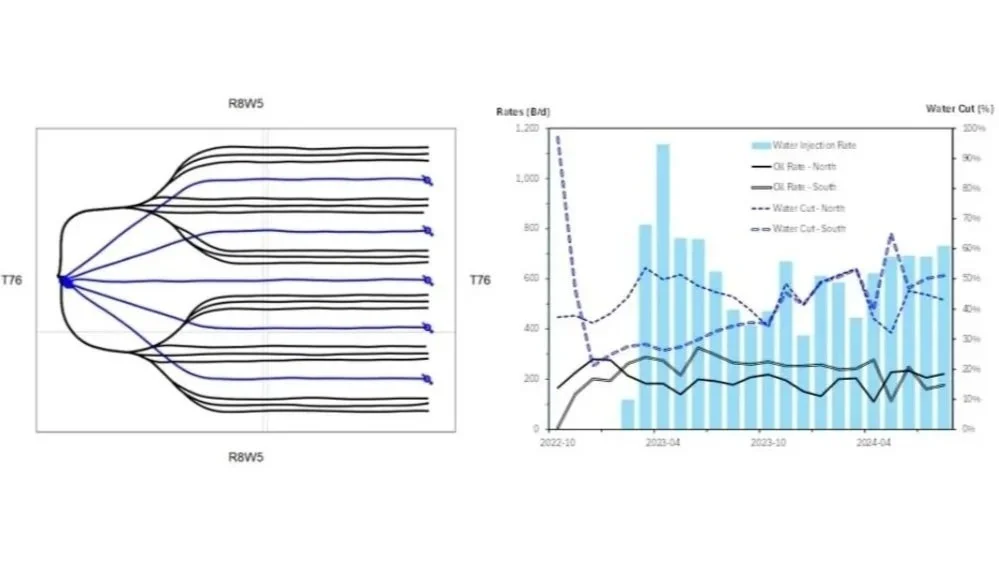
Figure 19: Laterals and history for higher water-cut project - Nipisi [Source: geoSCOUT]
There is clearly a strong correspondence in the trends in oil production rate and water between the two North and South wells. Some of the laterals that surround this project that are on primary production show similar progressions to high water cuts > 50%, suggesting that this behavior may be influenced by local water saturations and not necessarily by premature breakthrough of the injected water.
As in the prior example, although there is an increased requirement for handling produced water, the production levels of the wells/project remain flat and high, so that no changes in operation in the near future would be expected.
“Although a few of the projects have experienced higher water production due to either breakthrough of the injected water or possibly from local variations in connate water, oil production from these projects remains high and stable.”
Impacts of Waterflooding on Regional Production
The uplifts from each project were consolidated by area to examine the contributions that water injection to date have made to the total production.
Total production from the projects peaked in 2022 at almost 13,000 B/d. Figure 20 shows that without water injection, primary production would have dropped to 5,000 B/d by August 2024.
Initial implementation of waterflooding projects was undertaken later at Nipisi than at Marten Hills. However, the practice in the area expanded quickly, with production peaking in mid-2024 at 10,000 B/d and exceeding production from Marten Hills in August 2024. Figure 21 indicates that without water injection, primary production would have dropped to 7,000 B/d.
“Water injection has added ~4,000 B/d and has flattened production at Marten Hills.”
Martin Hills
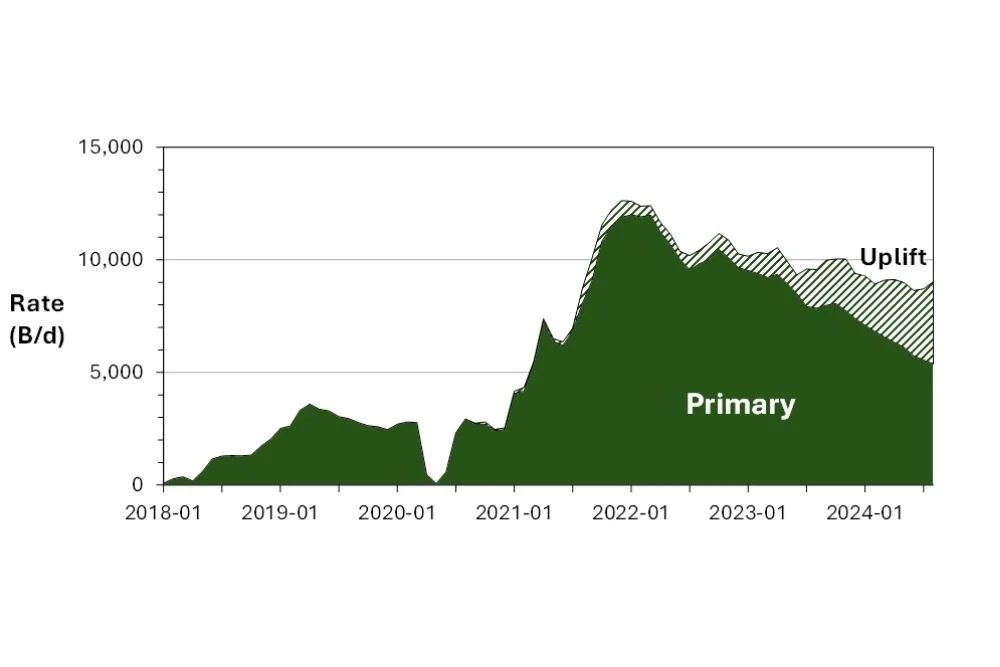
Figure 20: Production from waterflood projects at Marten Hills [Source: geoSCOUT, Peters & Co. Limited]
Nipisi
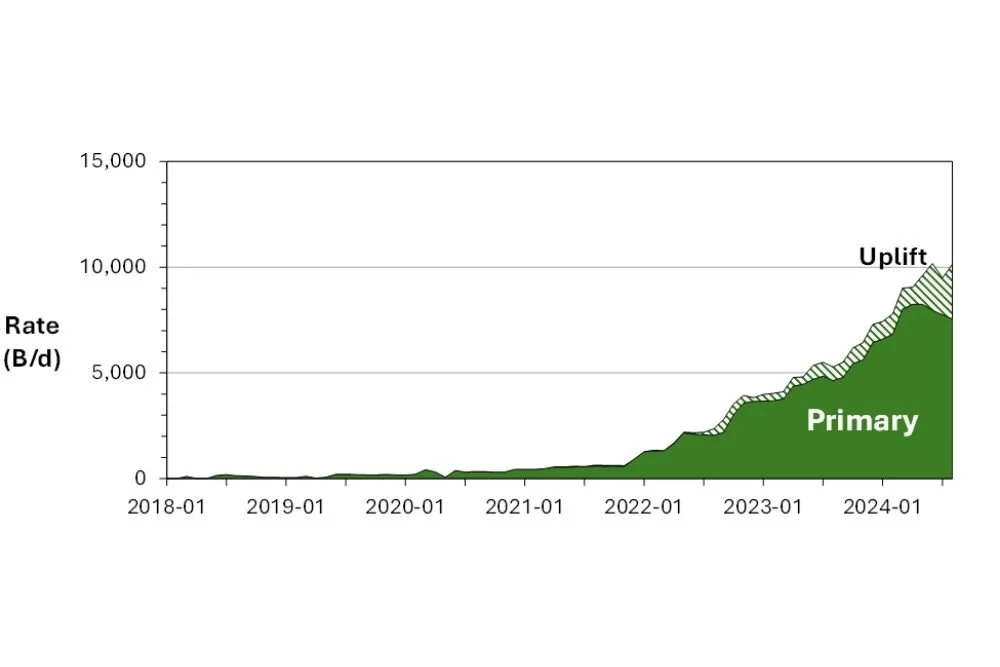
Figure 21: Production from waterflood projects at Nipisi [Source: geoSCOUT, Peters & Co. Limited]
“Water injection has added ~3,000 B/d and has flattened production in Nipisi projects.”
Clearwater Fairway
Consolidation of the rates from both areas shown in the previous two figures yields the final picture of the impact of water injection in the Clearwater.
“Water injection has allowed production in projects to continue to grow and has contributed almost 7,000 B/d of incremental production in August 2024.”
Discussions with operators regarding the estimates made for the individual projects have indicated that the estimates made herein were in line with their internal expectations. This supports the overall estimate of 7,000 B/d total uplift for industry.
Growth of Water Injection Volumes
From a regional perspective, the growth in total rate uplift provided by water injection has been mirrored by a growth in water injection rates, as shown in Figure 23.
Water injection into the Clearwater has grown at an exponential rate, doubling every 8 months and tracking with the growth in oil rate uplift.”
The growth rate in water injection and number of projects are of course controlled by the operators, but this pace is a clear demonstration of the confidence that the operators have in the performance and the potential for water injection.
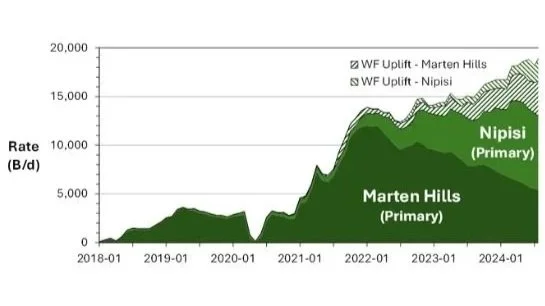
Figure 22: Production from projects in the main Clearwater fairway [Source: geoSCOUT, Peters & Co. Limited]
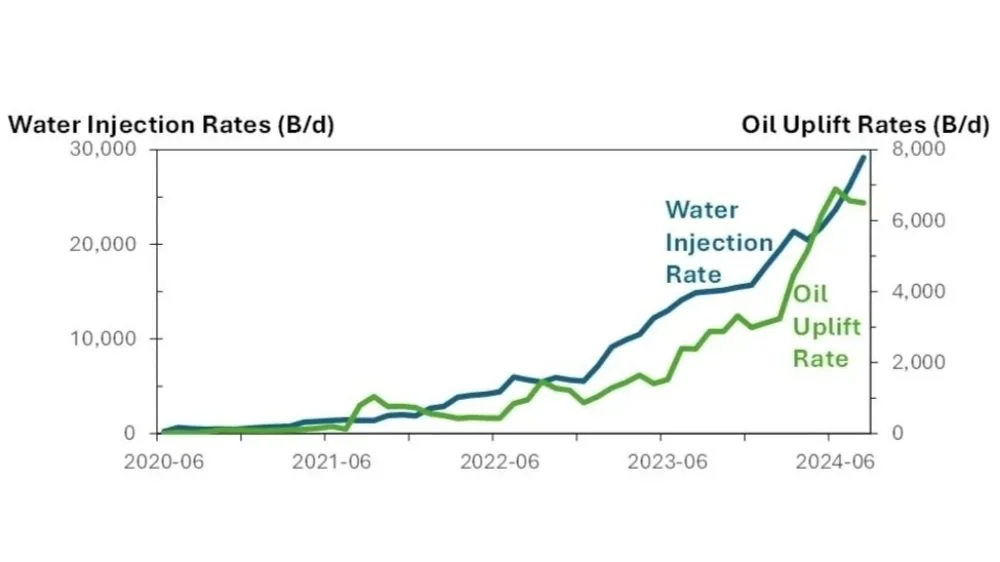
Figure 23: Injection and uplift history for waterflood projects [Source: geoSCOUT, Peters & Co. Limited]
Recovery Factors and Injection Pore Volumes
As noted in Part 1, it is “early days” for waterflooding in the Clearwater since material levels of water injection have only been underway since 2021-2022. Further support for this statement is provided by examining the performance to-date from the perspective of “Recovery vs PV injected” that is routinely used in assessing waterflooding, as shown in Figure 24.
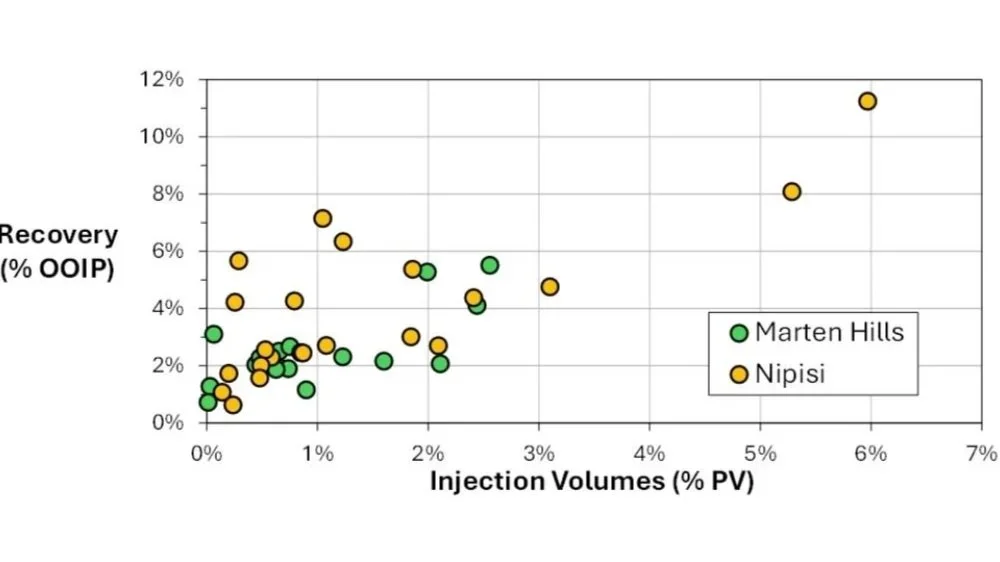
Figure 24: Recovery and PV injection data for waterflood projects as of August 2024 [Source: geoSCOUT]
Figure 24 indicates that 90% of the projects have injected less than 3% pore volumes of water. The recovery factors generally range from 2% to 6%, which provides an optimistic outlook for the 10% Expected Ultimate Recovery Factor currently assumed for waterflooding with further time and voidage replacement.
Summary and Key Takeaways
Waterflooding in heavy oil reservoirs is not new, with nearby water and polymer injection conducted at CNRL’s Pelican/Brintnell project since the early 2000’s. But it is certainly new for application in the main fairway of the Clearwater at Marten Hills and Nipisi, in which the oil and rock characteristics differ substantially from other heavy oil or oil sands areas.
“In view of performance to date, the outlook is good for waterflooding to exceed current expectations of 10% recovery in the Clearwater.”
The study underpinning this work was intended to develop a consistent protocol to assess the impact of water injection into the Clearwater and to make an assessment of its performance and outlook. Data, calculations and conclusions were reviewed with the operators - Headwater Exploration, Spur Petroleum and Tamarack Valley Energy – to help ensure the best quality input for calculations and ground-truthing of results and conclusions.
Key Metrics (as of August 2024)
140,000 B/d Total Clearwater oil production rate (now >150,000 B/d)
100,000 B/d Total oil production rate from the three waterflood operators in the Clearwater
20,000 B/d Total oil production rate under waterflood
~7,000 B/d Estimated incremental oil production rate attributed to water injection
30,000 B/d Total water injection rate
Key Takeaways
Clearwater development has grown at a significant pace since 2020.
The number of projects has grown from 11 (2022) to 25 (2023) to 40 (2024).
Rate uplifts have been observed in 75% of projects.
As of August 2024, water injection was directly responsible for about 30% of the total production from the Clearwater waterflood projects.
Significant reductions in producing GORs have been achieved.
Rate and GOR trends in the field are consistent with expectations from the pressure-support conceptual model shown in Figure 6.
Some water breakthrough has been identified but this has not been a general issue.
Outlook
Recovery factors are trending to exceed the initial expectation of 10% from waterflooding.
Only 23 of 300 developed sections are being waterflooded.
There is a significant potential for long-term growth.
There are development and operational challenges facing the industry as it plans for future development around the fairways, but the results of the analysis presented point towards continued and successful growth in waterflooding in the Clearwater.
The author wishes to express his appreciation to Peters & Co. Limited for permission to publish this work and to the management and technical staff of Headwater Exploration, Spur Petroleum and Tamarack Valley Energy for their valued input and discussions for this work.

Dr. Bruce Carey, is the Sr Technical Advisor, Research at Peters & Co. Limited, an investment institution specializing in the Canadian energy sector. In this role, he provides technical analyses and assessments of resources, projects and technologies to support investment decisions across the upstream and downstream, with particular focus on the in situ thermal sector.
He is a Chemical Engineer by training, with degrees from Stanford University and the University of Minnesota. Prior to his current role, he spent his career working for Exxon and Imperial for 32 years in a variety of upstream technical and management assignments.