
Successful Cyclical Waterflood Pilot in a Mature Heavy Oil Field in Eastern Alberta
ABSTRACT
Cyclical waterflooding can be applied in mature, heavy oil waterfloods to improve sweep efficiency and ultimate recovery. Modification of waterflood patterns has been successfully applied in several parts of the world such as the North Sea, Ecuador, Argentina, China and Russia. In this paper we will present a successful cyclical waterflood pilot applied in the Mannville Group in Chauvin, Alberta, Canada. The paper will illustrate the workflow for designing the cyclical waterflood, the challenges faced and the surveillance program developed. This technique can be used in mature heavy oil fields to increase production at minimal cost and to extend the economic life of those fields.
The Cyclical Waterflooding Concept
Cyclical flooding is a type of waterflood in which the patterns have intermittent periods of injection and shut-in. The practice is intended to establish new communication paths between injectors and producers, away from previously swept channels; in doing so, previously un-swept oil can be mobilized and produced. With successful waterflooding, it can be possible to:
Increase oil production rate or maintain oil production rate at lower associated produced water volumes, therefore reducing operating cost of the facility and production issues that are associated with water production such as scaling, etc.
Revive oil production at wells that have shown a strong channeling relationship with an offset injector.
There are several advantages of cyclical flooding:
It is inexpensive to apply in field operations.
There are no requirements to drill new wells or pump chemicals such as conformance gel to improve sweep.
It offers the potential to improve the understanding of reservoir inter-well communication in the mature stage of the field.
Cyclical flooding was first applied in the early 1960s. It has been applied in different fields worldwide including China, USA, Russia and North Sea (Munoz et al., SPE 179612 and Schipanov et al., SPE 116873). The results of numerical simulation and experimental studies reported in the literature note higher recoveries by up to 10% (Schipanov et al., SPE 116873). Others reported maintaining the same oil production with a reduced field water cut.
Cyclical Flooding Subsurface Impacts
Positive impacts from cyclic waterflooding can come from a variety of aspects, such as: Improvement in Areal Sweep Efficiency
When a high-rate cycle of injection is initiated at an injector, new flow paths (streamlines) can be created in previously un-swept areas to sweep the oil towards the producer.
When injection is shut-in, the reservoir pressure is reduced and oil can migrate into those swept pathways due to local pressure and capillarity (saturation) on gradients. With more oil in the higher mobility path, oil will have higher relative permeability. When injection is restarted, this oil will be swept to the producer. (Schipanov et al., SPE116873).
Vertical Crossflow Between Layers
Theoretical and empirical studies have shown that cyclic waterflooding can lead to crossflow between low and high permeable zones. When injection is stopped, the high permeable layers get depressurized first; cross flow of oil can then take place from the lower permeable zone to the higher permeable zone due to a pressure gradient.
Crossflow can also take place on a secondary role by capillary and gravity forces (Yaozhong et al., SPE 104440, Rublev et al., SPE 162015, and Schipanov et al., SPE 116873).
This crossflow requires vertical communication between different layers. The lower the vertical permeability, the better the cyclic waterflood impact, since this means lower vertical communication during the injection cycle.
Capillary and Gravity Forces
In water-wet rock, once injection stops, water will flow towards low permeable streaks due to imbibition, and oil will reverse flow from the low permeable streaks towards the more permeable streaks under reverse imbibition. Studies have shown that, for capillary effect to take place, the cycle duration needs to be over a certain duration (Schipanov et al., SPE 116873).
Flow from Dead-End Pores
In some reservoirs, oil can be trapped in local cul-de-sac features by high reservoir pressure in a waterflood. West et al. (2014) noted that, when water injection is stopped and the reservoir pressure is reduced, this trapped oil can start to flow out to the main waterflood pathway via solution gas drive as gas exsolves if the pressure drops below the bubble point.
Certain heterogeneous reservoirs may thus be good candidates for cyclical waterfloods. Schipanov et al. (SPE 116873) built an analytical model that showed that the positive impact of cyclic waterflooding increases with the increasing number of layers. In other words, the more heterogeneous the reservoir is both areally and vertically in the reservoir, the higher the expected uplift from cyclical flooding. Cyclical flooding is also recommended to be applied when there is strong communication or breakthroughs between injectors and producers and not before, according to modeling done by Brice et al. (SPE 170099).
Geology of the Pilot Area
The cyclical flood pilot was performed in the Sparky A Pool located in Sec 34- 042-04W4. The pool, shown in Figure 1, is estimated to have an OOIP of 35.35 MMBO with a current recovery factor of ~14.5%. Oil within the pool has a gravity of 17 o API and 530 cP at reservoir conditions. The current interpretation of the reservoir is a Rex-aged North – South trending channel system with multiple cross-cutting channels.
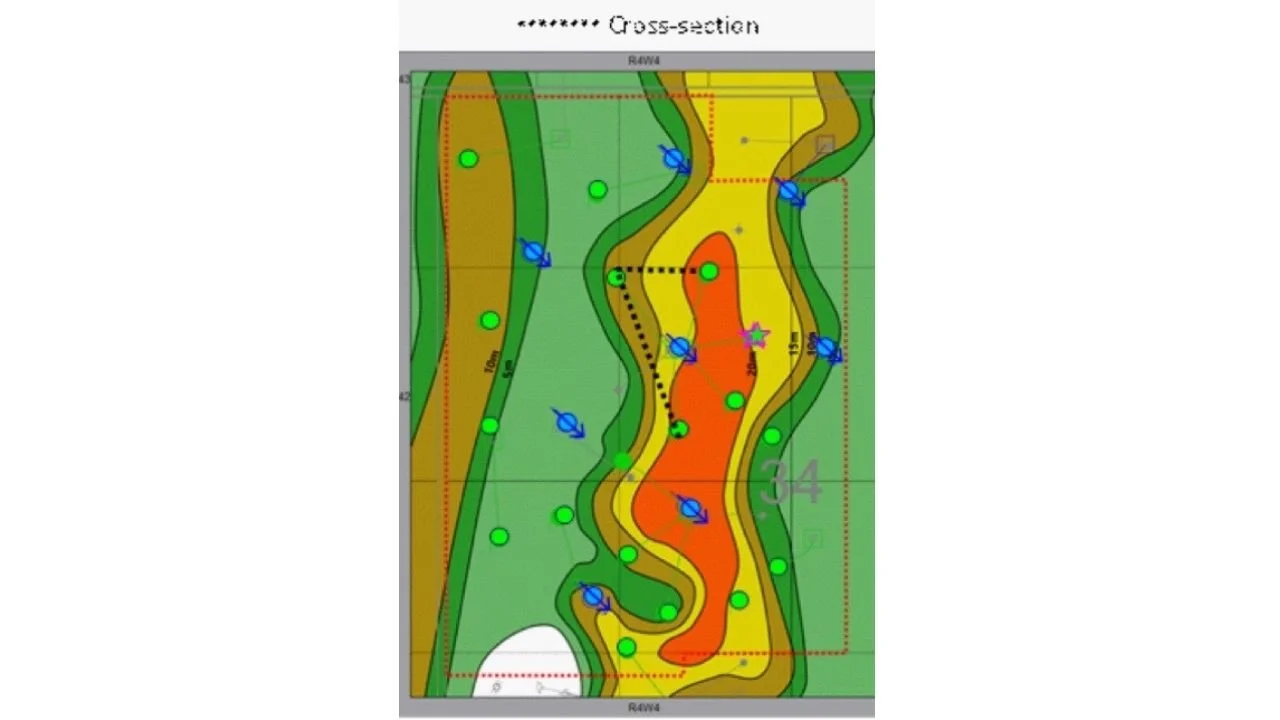
Figure 1: Rex Channel Net Pay Map
The channel system is overlain by the General Petroleum (GP) Formation and is underlain by the Detrital and/or Paleozoic..
The channel gross isopach ranges from several meters to over 60m in some localized areas. The map in Figure 1 shows a Total Net Pay map over the pilot area. Net pay within the pilot area varies from several meters to over 20m. In areas where higher Net Pay values are observed, it is important to consider that this is not one homogeneous unit, but rather the stacked accumulation of multiple channels.
Core porosities from 5 cores within the pool range from 15.5% to over 37%, with an arithmetic average porosity of 26%. Core-derived permeabilities range from sub-1mD to 6.79D, with an arithmetic average perm of 867mD. The stacking and cross-cutting natures of the channels within this system create stratigraphic complexity.
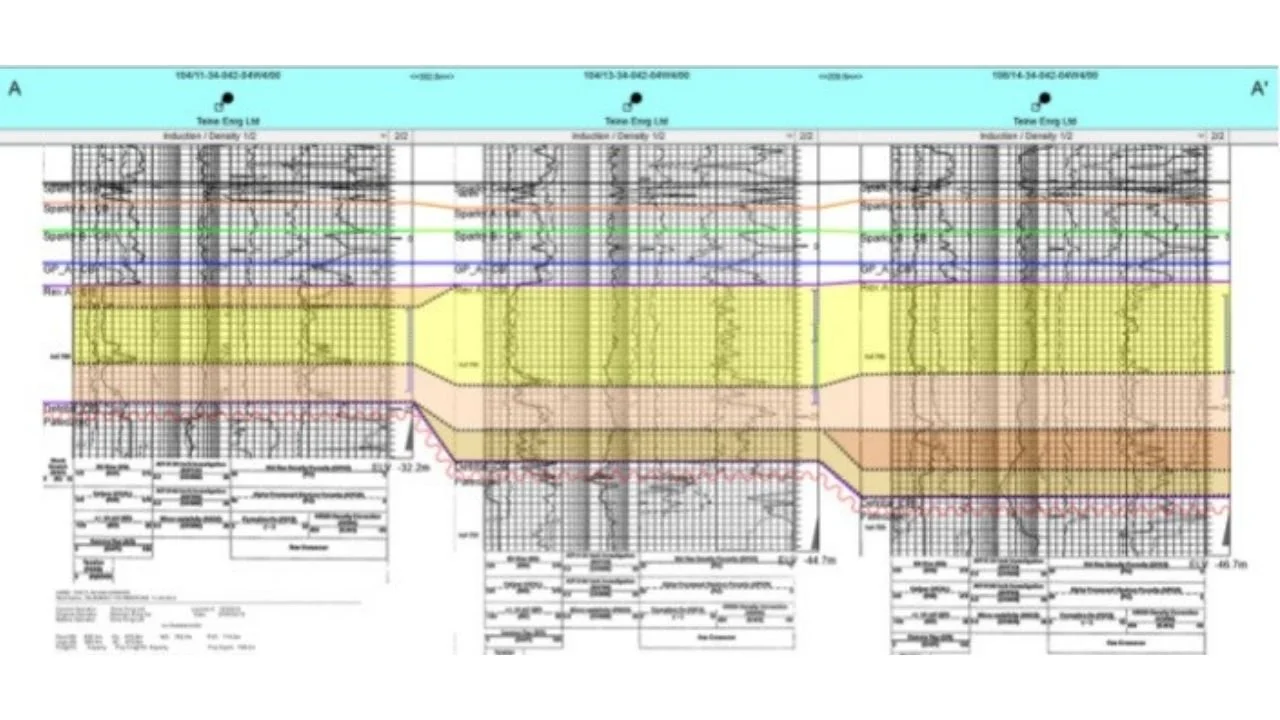
Figure 2: Rex Channel Cross-Section
Figures 1 and 2 show three wells located within the pilot area, highlighting a number of the channel sequences present in the pilot area. Both lateral and vertical permeability heterogeneity increases dramatically as these channels incise into one another.
Pilot Overview
The pilot area covers two pads (11-34 and 06-34) in the 11-34-042-04W4 battery with some peripheral wells. The wells included in the pilot area are a mix of vertical and deviated wells.
Average production statistics for the pilot area prior to the cyclical waterflood are listed below:
Fluid Rate: ~580 m3 /d
Oil Rate: ~13.8 m3 /d
Injection Rate: ~595 m 3 /d
VRR: ~1 Cum VRR: ~1
There were two cycles for the pilot run in May-July and August-December 2023. The locations of the pilot injectors and producers are shown in Figure 3.
Cyclical Flood Design and Surveillance
Cycle 1 Design and Performance
Cycle 1 design was carried out to have no injection in the “central” 11-34 and 6-34 injectors, with corresponding strong injection at other “peripheral” injection wells. The injection targets were set so that the pilot area voidage replacement ratio was set at 0.95 - 1. To compensate for the lost injection to the central wells, the peripheral wells injected at rates higher than those used during the continuous waterflood stage.
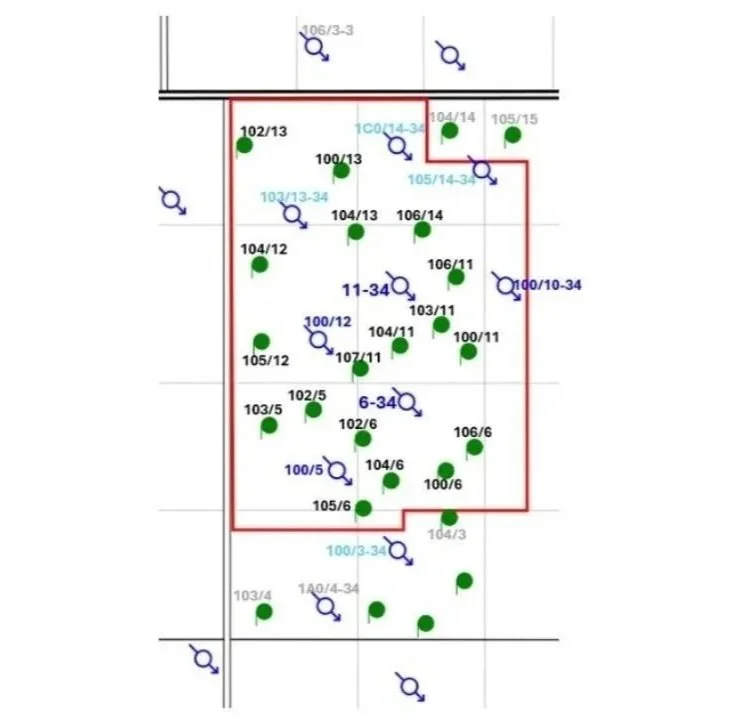
Figure 3: Pilot Area Outline and Wells
Cycle 2 Design and Performance
Cycle 2 design was carried out to have reduced peripheral injection with higher central injection. The injection targets were set so that the pilot area voidage replacement ratio remained in the range of 0.95 - 1.
One learning from Cycle 1 that was applied during Cycle 2 was to react to any wells going down for over a week by reducing injection.
Throughout both cycles, injection rates were adjusted according to the following observations:
For wells having high fluid levels that could not produce at higher rates due to artificial lift limitations, injection wells that were identified to be in communication with them were slowed to lower injection rates.
For wells that were pumped off, injection wells that were believed to be in communication with them were increased to higher rates.
Surveillance Plan
The surveillance plan included two components:
Fluid level shots to determine pressure changes in the producers. Water cut samples to identify trends in performance.
The following surveillance activities were conducted:
Fluid level shots were captured twice a week to define those wells that were very sensitive to injection changes.
Once sensitive wells were determined, their fluid levels were captured on a high frequency basis and other wells were then adjusted to a lower frequency basis.
Once steady state conditions were achieved after a new cycle was initiated, fluid level shots were reduced eventually to monthly.
Wellhead watercut samples were taken on a weekly basis. Eventually, watercut sampling frequency was also reduced.
A significant degree of slugging or variation in water cuts was observed.
Pilot Results and Analysis
As is shown in Figure 4, the year-end 2023 exit rate showed an increase in production of 13% over the 2022 exit rate and a decrease in water cut to below 97%.
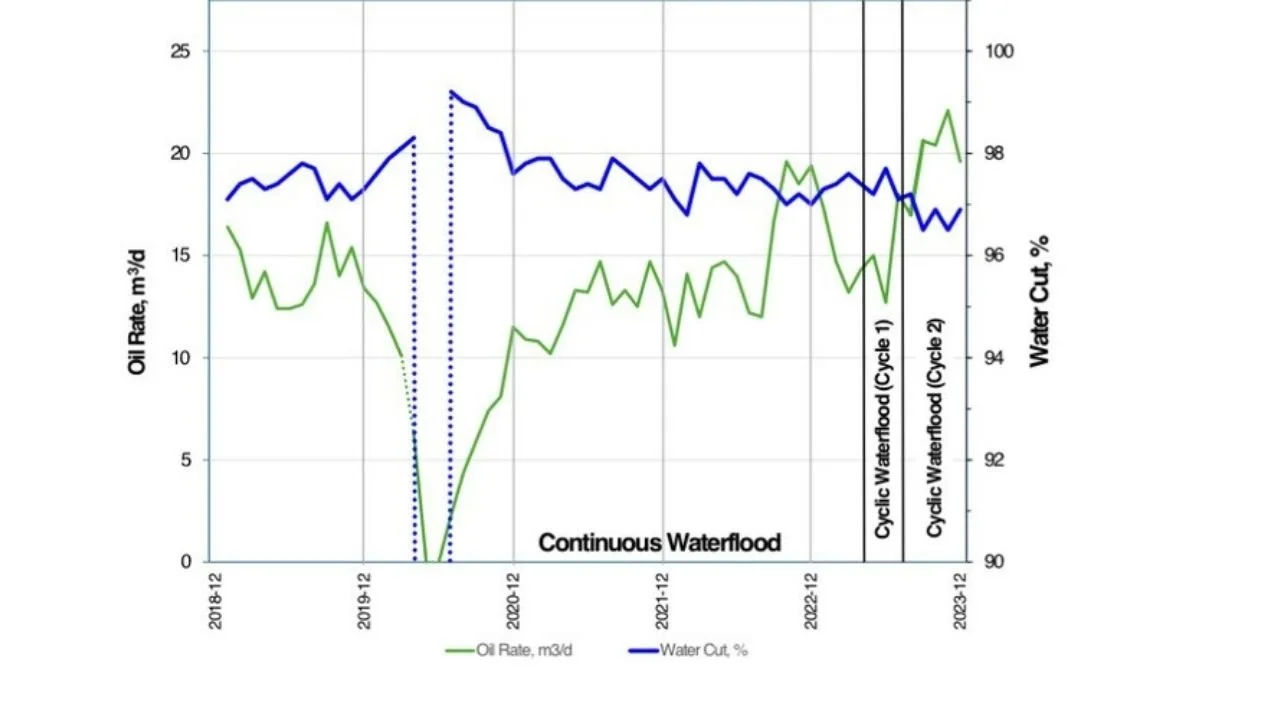
Figure 4: Pilot Area Production Performance
Given the monthly variations in both rate and water cut - both before and during the pilot test – a simple statistical test was conducted using Excel’s ANOVA feature to assess the level of confidence that could be placed in the positive changes in these metrics.
In a “single factor” ANOVA test, two data sets are compared in terms of average values and variances in the data sets.
The output of this comparison is a “P-Value” that describes the level of statistical confidence that can be placed in the hypothesis that the two average values and data sets are different. A P-Value of less than 0.05 is generally accepted to indicate a reasonably high level of confidence in the difference between the data and their averages.
Water-oil ratio and oil rate data during the Cyclical Waterflood pilot were compared to baseline values from January 2019 to April 2023; data from April 2020 to Nov 2020 was excluded since this period was affected by a major facility incident. For completeness, three comparisons were made in the changes in performance metrics:
Continuous waterflooding vs Cycle 1 – were there any significant changes observed?
Continuous waterflooding vs Cycle 1 and Cycle 2 – were there any significant changes observed when the two cycles were grouped together?
Continuous waterflooding + Cycle 1 vs Cycle 2 – was there a significant contribution from Cycle 2 to the final result?
The average values for the groups compared are shown below in Table 1. The narrow ranges of values in the data sets support the benefits of conducting the statistical analysis.
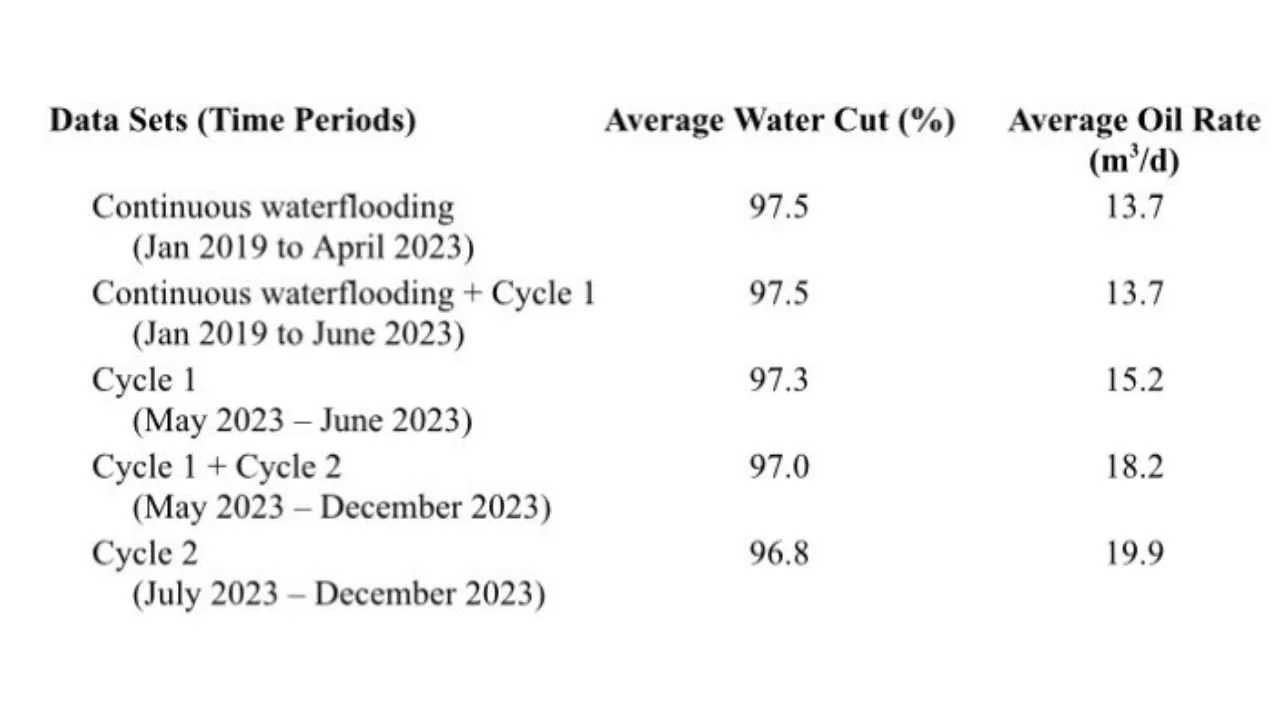
Table 1: Average values of metrics of data sets
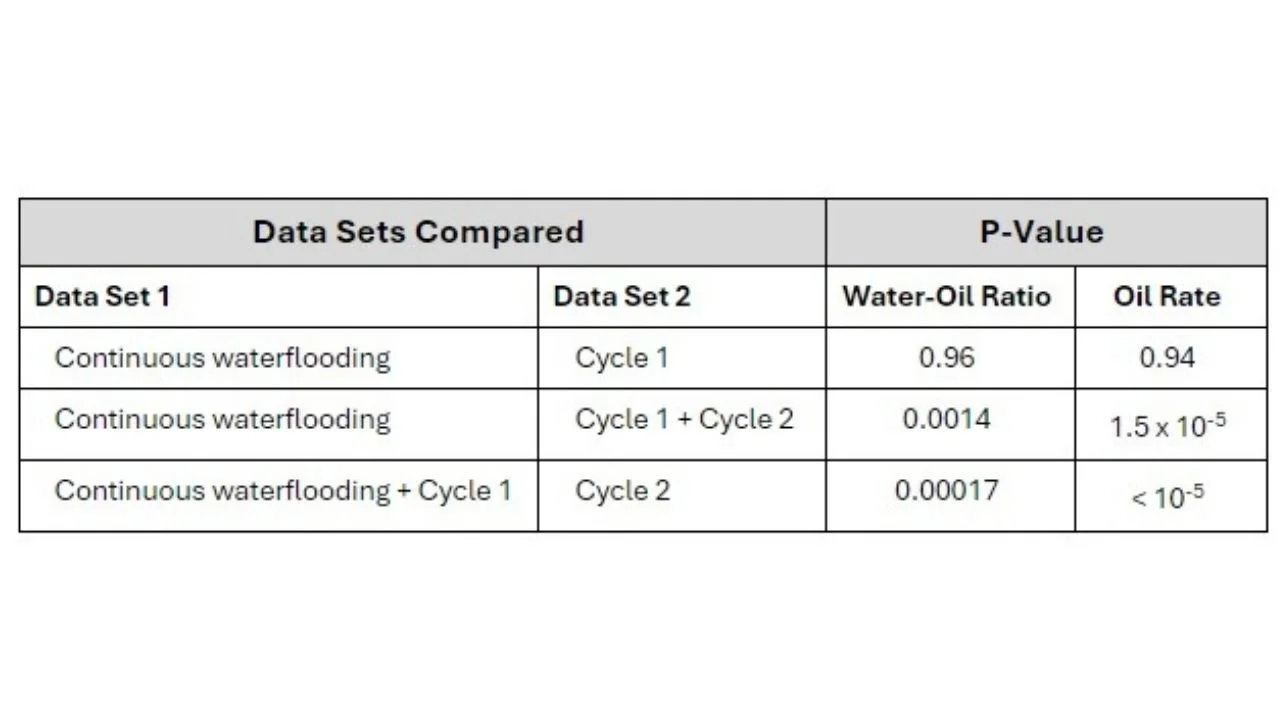
Table 2: Results of ANOVA tests: P-Values for comparison of data sets
The results of the ANOVA tests are shown in Table 2.
As was noted above, P-values below 0.05 can be understood to indicate statistical significance. These results support the conclusion that the Cyclic waterflood pilot (Cycle 1 and Cycle 2) was able to:
increase the average oil rate from 13.7 m3 /d during continuous waterflooding to 18.2 m3 /d during the pilot
decrease the average water cut from 97.5% during the continuous waterflood to 97.0% during the pilot
As was noted earlier in the “Cyclic Flood design and Surveillance” section, the improved performance observed in Cycle 2 could have been aided by reducing injection in response to any wells going down for over a week.
Because of the comparatively short duration of Cycle 1, it is not possible to comment on whether any improvements would have been observed had Cycle 1 been conducted for a longer time. However, it is clear that the full cyclical flood was able to increase the 11-34-042-04W4 battery production to the highest level since March 2020. This led to a lower fixed opex component/bbl, therefore reducing opex/bbl vs plan by 18%. (Figure 5).
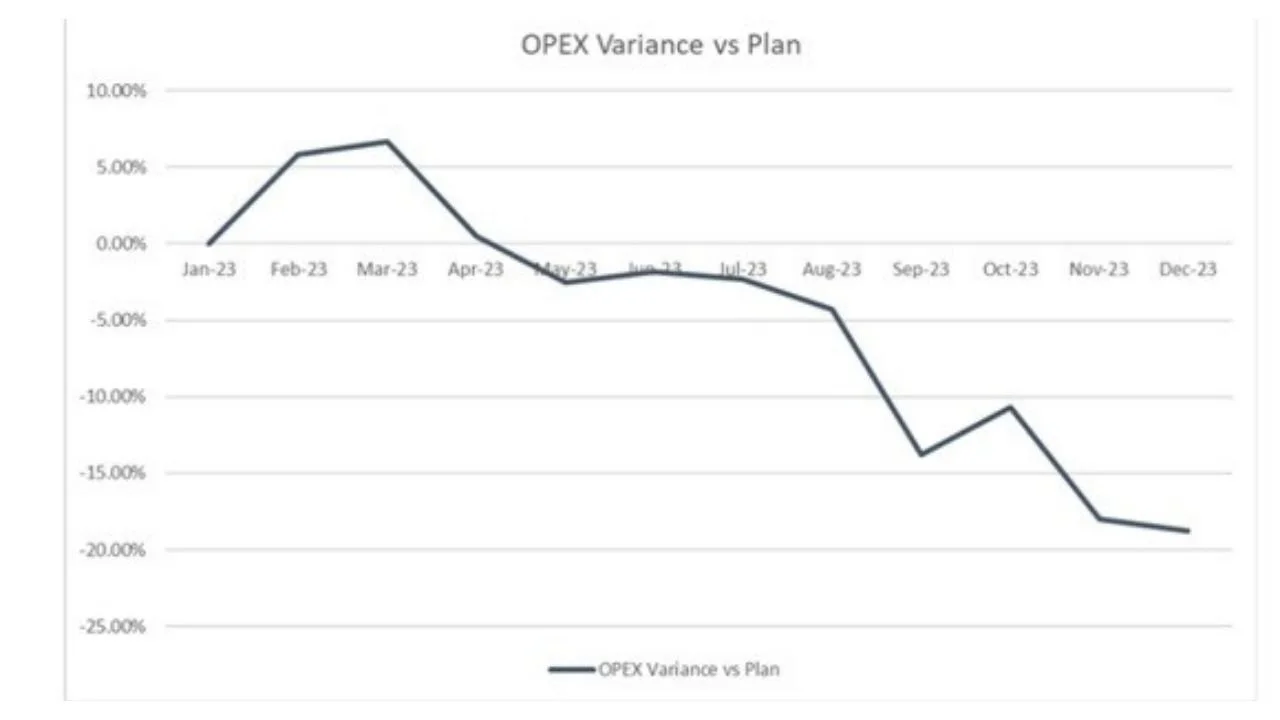
Figure 5. Opex Variance vs Plan
Concluding Comments
The cyclical waterflood pilot in 11-34-042-04W4 battery was deemed to be successful. As a result of its success, other pilots were started in the Chauvin field. The success of this pilot would not have been possible without a well- implemented surveillance program. The data from the surveillance program helped manage the cyclical flood design during its operation and achieve the successful improvement in production performance. Throughout both cycles of the cyclical flood, a better understanding of inter-well communication was obtained.
Acknowledgments
The authors would like to acknowledge and thank Dr. Bruce Carey for his valuable contributions and guidance that were integrated into this paper and improved it.
References
Yaozhong, Y., Tao, D., and Chengfeng, W., “The Reservoir Simulation Research and Extending Application About Cyclic Water Injection”, presented at the International Oil & Gas Conference and Exhibition in China, Dec 2006. SPE-104440-MS. https://doi.org/10.2118/104440-MS.
Munoz, M. A., and Rivadeneira, M. V., “Improved Oil Recovery Through Unsteady Waterflooding Conditions- Cyclic Waterflooding Application in Tiguino Field, Ecuador”, presented at the SPE Improved Oil Recovery Conference, Oklahoma. April 2016. SPE- 179612-MS. https://doi.org/10.2118/179612-MS.
Qingfeng, Y., Bingyu, J., and Jiping, Y., “Mechanism of Cyclic in Waterflooding in Vertically Heterogeneous Reservoirs”, SPE Advanced Technology Series. 5 (01): 24-27. SPE- 30881-PA. https://doi.org/10.2118/30881-PA
Schipanov, A. A., Surguchev, L. M., and Jakobsen, S. R., “Improved Oil Recovery by Cyclic Injection and Production”, presented at the SPE Russian Oil and Gas Technical Conference and Exhibition in Moscow, Oct 2008. SPE-116873-MS. https://doi.org/10.2118/116873-MS
Rublev, A. B., Khuzeev, Y. A., Ishimov, I. A., and Fedorov, K. M., “Predictions of Cyclic Water Injection on Urnenskoe Oil Field”, presented at the SPE Russian Oil and Gas Technical Conference and Exhibition in Moscow, Oct 2012. SPE-162015-MS. https://doi.org/10.2118/162015-MS
Vittoratos, E. S., Zhu, Z., and West, C. C., “Optimal Waterflood Voidage Management Significantly Increases Oil Recovery with Minimal Incremental Cost”, presented at the Abu Dhabi International Petroleum Exhibition and Conference in Abu Dhabi, UAE, November 2014. SPE-171937-MS. https://doi.org/10.2118/171937-MS
Stirpe, M. T., Guzman, J., Manrique, E., and Alvarado, V., “Cyclic Water Injection Simulations for Evaluations of its Potential in Lagocinco Field”, presented at the SPE/DOE Symposium on Improved Oil Recovery in Tulsa, Oklahoma, April 2004. SPE- 89378-MS. https://doi.org/10.2118/89378-MS
Brice, B., Ning, S., Wood, A., and Renouf, G., “Optimum Voidage Replacement Ratio and Operational Practice for Heavy Oil Waterfloods”, presented at the SPE Heavy Oil Conference in Calgary, Alberta, June 2014. SPE-170099-MS. https://doi.org/10.2118/170099-MS

Chad Bobier
Senior Geologist at Teine Energy
Sherif Abdelrahman is a Senior Exploitation Engineer in the Heavy Oil team at Teine Energy. Sherif has more than 12 years of industry experience in reservoir and production engineering; and has worked in different international locations on both onshore and offshore oil and gas fields whilst working for Repsol, BP, BG Group and Dragon Oil. Sherif has a Masters Degree in Petroleum Engineering from Heriot-Watt University and is a Registered Engineer with APEGA.
Chad Bobier is a Senior Geologist at Teine Energy working on the Heavy Oil Team. Chad has over 14 years of experience working on assets across the WCSB and in the United States. Prior to joining Teine Chad held positions at Enerplus, Clearview and Repsol. Chad has a bachelor’s degree in Geology from the University of Calgary and is a Registered Geologist with APEGA.

Senior Exploitation Engineer at Teine Energy